New Hampshire 2016 LiDAR Project Report
Cessna T210 Turbo Centurion · Other Documents
Overview
This document is a project report detailing the New Hampshire 2016 LiDAR acquisition task order, which was executed under USGS Contract # G16PC00016. The report outlines the scope, planning, equipment used, and processing of LiDAR data collected over a significant area. It highlights the aircraft utilized for the project, including the Cessna T210 Turbo Centurion, and provides specifications for the LiDAR systems employed. The report serves as a comprehensive overview of the project, including deliverables and accuracy testing results, aimed at stakeholders interested in the data acquisition and processing methodologies used during the project.
- The Cessna T210 Turbo Centurion was used for LiDAR data collection in the project.
- The project area covered approximately 1,375 square miles with a total of 15 flights conducted.
- The LiDAR sensors used included the Optech ALTM Galaxy T1000 and Riegl LMS Q1560.
- The required Non-Vegetated Vertical Accuracy (NVA) was 19.6 cm at a 95% confidence level.
- The project produced various deliverables, including classified LiDAR point cloud data and hydro-flattened DEM tiles.
Document
Source
Originally published by lidar.unh.edu. Sprinkle hosts a reference copy with an added summary, specifications and searchable full text.
Document details
- Type
- Other Documents
- Year
- 2019
- Pages
- 24
- File size
- 15 MB
- Publisher
- lidar.unh.edu
Most owners only have the POH. Here's the essential set for the Cessna T210 Turbo Centurion.
- Pilot's Operating Handbook / AFM
- Checklist
- Maintenance Manual
- Parts Catalog (IPC)
- Systems & Wiring
- Service Bulletins
- Type Certificate (TCDS)
Free — save the T210 Turbo Centurion to your watchlist and track it in one place.
More Cessna T210 Turbo Centurionmanuals & documents
If you fly the Cessna T210 Turbo Centurion, you may also be researching these.


In this document
Summary / Scope
The report summarizes the New Hampshire 2016 LiDAR acquisition project, covering approximately 1,375 square miles. It outlines the project scope, including aerial data collection specifications and deliverables, and confirms that no significant issues arose during the project.
Planning / Equipment
This section details the flight planning process, which was tailored to project requirements, including vegetation and altitude restrictions. It lists the aircraft used, notably the Cessna T210 Turbo Centurion, and describes the LiDAR sensors employed, such as the Optech ALTM Galaxy T1000.
Aircraft
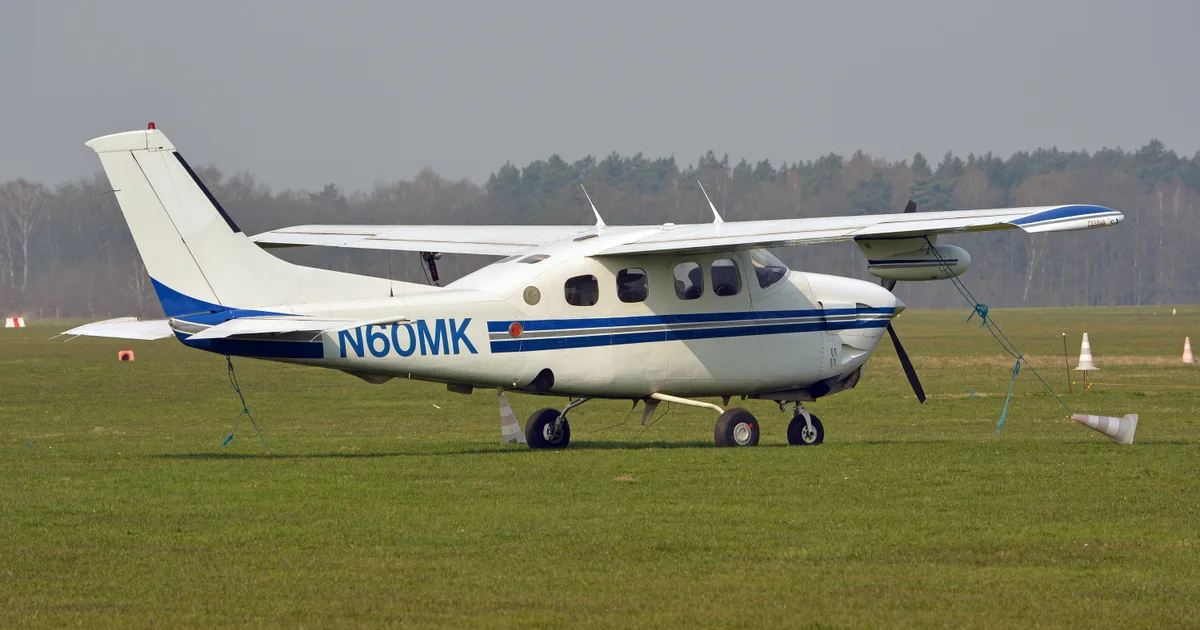
The project utilized several aircraft for LiDAR collection, including the Cessna T210 Turbo Centurion (Tail Number: N69WA). This aircraft was chosen for its stability and speed, which are beneficial for data collection.
Processing Summary
This section discusses the post-processing of airborne GPS and inertial data, which is crucial for the accurate positioning of the LiDAR sensor. It describes the software used for processing and the generation of the point cloud data.
Ground Control and Check Point Collection
The report outlines the collection of ground control points for accuracy testing, detailing the methodologies used to ensure high positional accuracy. It includes results from accuracy tests for both non-vegetated and vegetated areas.
Full document text
USGS Contract # G16PC00016 Task Order # G16PD01240 Submitted: April 25, 2019 Quantum Spatial, Inc 523 Wellington Way, Suite 375 Lexington, KY 40503 859-277-8700 Prepared by: New Hampshire 2016 LiDAR Project Report April 25, 2019 Page ii of iiiNew Hampshire 2016 LiDAR Project Project Report Contents 1. Summary / Scope ...............................................................................................................................................1 1.1. Summary .................................................................................................................................................1 1.2. Scope ......................................................................................................................................................1 1.3. Coverage ................................................................................................................................................1 1.4. Duration .................................................................................................................................................1 1.5. Issues ......................................................................................................................................................1 1.6. Deliverables .........................................................................................................................................2 2. Planning / Equipment ..................................................................................................................................... 4 2.1. Flight Planning ................................................................................................................................... 4 2.2. LiDAR Sensor ..................................................................................................................................... 4 2.3. Aircraft..................................................................................................................................................7 2.4. Base Station Information .................................................................................................................8 2.5. Time Period .......................................................................................................................................10 3. Processing Summary ...................................................................................................................................... 11 3.1. Flight Logs........................................................................................................................................... 11 3.2. LiDAR Processing............................................................................................................................. 12 3.3. LAS Classification Scheme ............................................................................................................ 13 3.4. Classified LAS Processing ............................................................................................................. 13 3.5. Hydro-Flattened Breakline Creation ........................................................................................... 14 3.6. Hydro-Flattened Raster DEM Creation ....................................................................................... 14 3.7. Intensity Image Creation ................................................................................................................ 14 4. Project Coverage Verification ...................................................................................................................... 15 5. Ground Control and Check Point Collection ............................................................................................ 17 5.1. Calibration Control Point Testing.................................................................................................. 17 5.2. Point Cloud Testing ......................................................................................................................... 17 5.3. Digital Elevation Model (DEM) Testing ....................................................................................... 18 April 25, 2019 Page iii of iiiNew Hampshire 2016 LiDAR Project Project Report List of Figures Figure 1. LiDAR Project Boundary .....................................................................................................................3 Figure 2. Planned LiDAR Flight Lines ...............................................................................................................5 Figure 3. The Optech Galaxy T1000 and Riegl LMS Q1560 LiDAR Sensors ............................................6 Figure 4. Some of Quantum Spatial’s Planes ..................................................................................................7 Figure 5. Base Station Locations .......................................................................................................................9 Figure 6. Flightline Swath LAS File Coverage .............................................................................................. 16 Figure 7. Calibration Control Point Locations............................................................................................... 19 Figure 8. QC Checkpoint Locations - NVA ................................................................................................... 20 Figure 9. QC Checkpoint Locations - VVA .................................................................................................... 21 List of Tables Table 1. Originally Planned LiDAR Specifications ...........................................................................................1 Table 2. Lidar System Specifications ................................................................................................................6
Show full textShow less
Table 3. Base Station Locations .........................................................................................................................8 List of Appendices Appendix A: GPS / IMU Processing Statistics, Flight Logs, and Base Station Logs Appendix B: Survey Report April 25, 2019 Page 1 of 21New Hampshire 2016 LiDAR Project Project Report 1.1. Summary This report contains a summary of the New Hampshire 2016 LiDAR acquisition task order, issued under USGS Contract # G16PC00016, Task Order # G16PD01240 on September 24, 2016. The task order yielded a project area covering approximately 1,375 square miles over the originally planned AOI, and 63 square miles over the MOD2 AOI. The intent of this document is only to provide specific validation information for the data acquisition/collection work completed as specified in the task order. 1.2. Scope Aerial topographic LiDAR was acquired using state of the art technology along with the necessary surveyed ground control points (GCPs) and airborne GPS and inertial navigation systems. The aerial data collection was designed with the following specifications listed in Table 1 below. Table 1. Originally Planned LiDAR Specifications AOI Average Point Density Flight Altitude (AGL) Field of View Minimum Side Overlap RMSEz Original 2 pts / m2 1800 m 47° 30% ≤ 10 cm MOD2 8 pts / m2 2300 m 58° 30% ≤ 10 cm 1. Summary / Scope 1.3. Coverage The LiDAR project boundary covers approximately 1,375 square miles over the originally planned AOI, and 63 square miles over the MOD2 AOI. A buffer or 100 meters was created to meet task order specifications. LiDAR extents are shown in Figure 1. 1.4. Duration LiDAR data was acquired from 12 November 2016 to 24 May 2018 in fifteen total lifts. See “Section: 2.6. Time Period” for more details. 1.5. Issues There were no issues to report for this project. April 25, 2019 Page 2 of 21New Hampshire 2016 LiDAR Project Project Report 1.6. Deliverables The following products were produced and delivered: • Classified LiDAR point cloud data tiles in .LAS 1.4 format • 2.5-foot bare earth hydro-flattened DEM tiles in GeoTIFF format • Continuous hydro-flattened and bridge breaklines in Esri file geodatabase format • 2.5-foot intensity imagery tiles in GeoTIFF format • Calibration and QC checkpoints in Esri shapefile format • Processing boundary in Esri shapefile format • Tile index in Esri shapefile format • Project and deliverable metadata in .XML format • GPS/IMU statistics and flight logs in .PDF format • Survey report in .PDF format • Project report in .PDF format All geospatial deliverables were produced in NAD83 (2011), New Hampshire State Plane FIPS 2800 and NAVD88, feet. Tiled deliverables have a tile size of 5,000 feet x 5,000 feet (original AOI) and 2,500 feet x 2,500 feet (MOD2 AOI). April 25, 2019 Page 3 of 21New Hampshire 2016 LiDAR Project Project Report Figure 1. Project Boundary April 25, 2019 Page 4 of 21New Hampshire 2016 LiDAR Project Project Report 2. Planning / Equipment 2.1. Flight Planning Flight planning was based on the unique project requirements and characteristics of the project site. The basis of planning included: required accuracies, type of development, amount / type of vegetation within project area, required data posting, and potential altitude restrictions for flights in project vicinity. Detailed project flight planning calculations were performed for the project using Optech FMS Planner and Riegl RiPARAMETER planning software. The entire target area was comprised of 744 planned flight lines measuring approximately total 5,487 flight line miles (Figure 2). 2.2. LiDAR Sensor Quantum Spatial utilized an Optech ALTM Galaxy T1000 LiDAR sensor (Figure 3), serial number 354, during the project. These systems are capable of collecting data at a maximum frequency of 550 kHz. These systems utilize a Multi-Pulse in the Air option (MPIA). These sensors are also equipped with the ability to measure up to 8 returns per outgoing pulse. Quantum Spatial also utilized a Riegl LMS Q1560 LiDAR sensor (Figure 3), serial number 175, during the project. The Riegl LMS-Q1560 system can collect data at a maximum pulse repetition rate of 800 kHz, affording an effective rate of 532,000 measurements on the ground. The sensor’s multiple time around processing software automatically resolves range ambiguities and handles more than 10 simultaneous pulses in the air. A brief summary of the aerial acquisition parameters for the project are shown in the LiDAR System Specifications in Table 2. April 25, 2019 Page 5 of 21New Hampshire 2016 LiDAR Project Project Report Figure 2. Planned Flight Lines April 25, 2019 Page 6 of 21New Hampshire 2016 LiDAR Project Project Report Figure 3. The Optech Galaxy T1000 and Riegl LMS Q1560 LiDAR Sensors Table 2. Lidar System Specifications Optech Riegl Terrain and Aircraft Scanner Flying Height (m) 2100 2300 Recommended Ground Speed (kts) 150 130 Scanner Field of View (deg) 40 58 Scan Rate Setting Used (Hz) 53.4 67.6 Laser Laser Pulse Rate Used (kHz) 260.4 251.8 Multi Pulse in Air Mode yes yes Coverage Full Swath Width (m) 1529 729 Line Spacing (m) 810 1,242 Point Spacing and Density Average Nominal Point Spacing (m) 0.67 0.44 Average Point Density (pts / m2) 2.21 5.17 April 25, 2019 Page 7 of 21New Hampshire 2016 LiDAR Project Project Report 2.3. Aircraft All flights for the project were accomplished through the use of customized planes. Plane type and tail numbers are listed below. LiDAR Collection Planes • Cessna T210 Turbo Centurion (piston-single) (T210), Tail Number: N69WA • Cessna Centurion (piston-single) (C210), Tail Number: N210AX • Piper Navajo (twin-piston) (PA31), Tail Number: N73TM • Pilatus PC-12 (single-turboprop) (PC12), Tail Number: N869 These aircraft provided an ideal, stable aerial base for LiDAR and orthoimagery acquisition. These aerial platforms have relatively fast cruise speeds which are beneficial for project mobilization / demobilization while maintaining relatively slow stall speeds which proved ideal for collection of high-density, consistent data posting using state-of-the-art Optech and Riegl LiDAR systems. Some of Quantum Spatial’s operating aircraft can be seen in Figure 4 below. Figure 4. Some of Quantum Spatial’s Planes April 25, 2019 Page 8 of 21New Hampshire 2016 LiDAR Project Project Report 2.4. Base Station Information GPS base stations were utilized during all phases of flight (Table 3). The base station locations were verified using NGS OPUS service and subsequent surveys. Base station locations are depicted in Figure 5. Data sheets, graphical depiction of base station locations or log sheets used during station occupation are available in Appendix A. Table 3. Base Station Locations Base Station Northing (Y) Easting (X) Ellipsoid Height (m) GW 4872803.082 343693.7308 107.459 WDSK 5110396.279 609224.6846 37.773 MELI 5023467.162 538578.5866 54.567 MECC 4963641.406 520233.294 20.586 V009_V007141A 5056786.411 598146.9267 100 V008_V001141A 5019316.526 599864.4906 100 V008 5080460.754 573490.3081 100 V007 5069217.553 513293.9506 100.015 LEW1 4878130.754 396922.9837 51.351 MESP 4897242.358 379135.1699 105.463 BARN 4885144.952 327146.5962 140.793 MEFR 4947439.488 410292.1216 131.643 MERA 4981358.283 369663.4257 489.568 April 25, 2019 Page 9 of 21New Hampshire 2016 LiDAR Project Project Report Figure 5. Base Station Locations April 25, 2019 Page 10 of 21New Hampshire 2016 LiDAR Project Project Report • 20161112-A (N69WA, SN354) • 20171111-A (N73TM, SN175) • 20161114-A (N69WA, SN354) • 20180509-A (N869, SN354) • 20161118-A (N69WA, SN354) • 20180510-A (N869, SN354) • 20161119-A (N69WA, SN354) • 20180511-A (N869, SN354) • 20170520-A (N210AX, SN354) • 20180512-A (N869, SN354) • 20170521-A (N210AX, SN354) • 20180518-A (N869, SN354) • 20171108-B (N73TM, SN175) • 20180524-A (N869, SN354) • 20171109-A (N73TM, SN175) 2.5. Time Period Project specific flights were conducted over four months across three years. Fifteen sorties, or aircraft lifts were completed. Accomplished sorties are listed below. April 25, 2019 Page 11 of 21New Hampshire 2016 LiDAR Project Project Report 3.1. Flight Logs Flight logs were completed by LIDAR sensor technicians for each mission during acquisition. These logs depict a variety of information, including: • Job / Project # • Flight Date / Lift Number • FOV (Field of View) • Scan Rate (HZ) • Pulse Rate Frequency (Hz) • Ground Speed • Altitude • Base Station • PDOP avoidance times • Flight Line # • Flight Line Start and Stop Times • Flight Line Altitude (AMSL) • Heading • Speed • Returns • Crab Notes: (Visibility, winds, ride, weather, temperature, dew point, pressure, etc). Project specific flight logs for each sortie are available in Appendix A. 3. Processing Summary April 25, 2019 Page 12 of 21New Hampshire 2016 LiDAR Project Project Report 3.2. LiDAR Processing Applanix + POSPac Mobile Mapping Suite software was used for post-processing of airborne GPS and inertial data (IMU), which is critical to the positioning and orientation of the LiDAR sensor during all flights. POSPac combines aircraft raw trajectory data with stationary GPS base station data yielding a “Smoothed Best Estimate Trajectory (SBET) necessary for additional post processing software to develop the resulting geo-referenced point cloud from the LiDAR missions. During the sensor trajectory processing (combining GPS & IMU datasets) certain statistical graphs and tables are generated within the Applanix POSPac processing environment which are commonly used as indicators of processing stability and accuracy. This data for analysis include: Max horizontal / vertical GPS variance, separation plot, altitude plot, PDOP plot, base station baseline length, processing mode, number of satellite vehicles, and mission trajectory. All relevant graphs produced in the POSPac processing environment for each sortie during the project mobilization are available in Appendix A. The generated point cloud is the mathematical three dimensional composite of all returns from all laser pulses as determined from the aerial mission. Laser point data are imported into TerraScan and a manual calibration is performed to assess the system offsets for pitch, roll, heading and scale. At this point this data is ready for analysis, classification, and filtering to generate a bare earth surface model in which the above-ground features are removed from the data set. Point clouds were created using the Optech DashMap and RiPROCESS post processing software. GeoCue distributive processing software was used in the creation of some files needed in downstream processing, as well as in the tiling of the dataset into more manageable file sizes. TerraScan and TerraModeler software packages were then used for the automated data classification, manual cleanup, and bare earth generation. Project specific macros were developed to classify the ground and remove side overlap between parallel flight lines. All data was manually reviewed and any remaining artifacts removed using functionality provided by TerraScan and TerraModeler. Global Mapper was used as a final check of the bare earth dataset. GeoCue was used to create the deliverable industry-standard LAS files for both the All Point Cloud Data and the Bare Earth. In-house software was then used to perform final statistical analysis of the classes in the LAS files. April 25, 2019 Page 13 of 21New Hampshire 2016 LiDAR Project Project Report 3.3. LAS Classification Scheme The classification classes are determined by the USGS Version 1.2 specifications and are an industry standard for the classification of LIDAR point clouds. All data starts the process as Class 1 (Unclassified), and then through automated classification routines, the classifications are determined using TerraScan macro processing. The classes used in the dataset are as follows and have the following descriptions: • Class 1 – Processed, but Unclassified – These points would be the catch all for points that do not fit any of the other deliverable classes. This would cover features such as vegetation, cars, etc. • Class 2 – Bare-Earth Ground – This is the bare earth surface • Class 7 – Low Noise – Low points, manually identified below the surface that could be noise points in point cloud. • Class 9 – Water – Points found inside of inland lake/ponds • Class 10 – Ignored Ground – Points found to be close to breakline features. Points are moved to this class from the Class 2 dataset. This class is ignored during the DEM creation process in order to provide smooth transition between the ground surface and hydro flattened surface. • Class 17 – Bridge Decks – Points falling on bridge decks. • Class 18 – High Noise – High points, manually identified above the surface that could be noise points in point cloud. 3.4. Classified LAS Processing The bare earth surface is then manually reviewed to ensure correct classification on the Class 2 (Ground) points. After the bare- earth surface is finalized; it is then used to generate all hydro- breaklines through heads-up digitization. All ground (ASPRS Class 2) LiDAR data inside of the Lake Pond and Double Line Drain hydro flattening breaklines were then classified to water (ASPRS Class 9) using TerraScan macro functionality. A buffer of 3 feet was also used around each hydro flattened feature to classify these ground (ASPRS Class 2) points to Ignored ground (ASPRS Class 10). All Lake Pond Island and Double Line Drain Island features were checked to ensure that the ground (ASPRS Class 2) points were reclassified to the correct classification after the automated classification was completed. All overlap data was processed through automated functionality provided by TerraScan to classify the overlapping flight line data to approved classes by USGS. The overlap data was identified using the Overlap Flag, per LAS 1.4 specifications. All data was manually reviewed and any remaining artifacts removed using functionality provided by TerraScan and TerraModeler. Global Mapper is used as a final check of the bare earth dataset. GeoCue was then used to create the deliverable industry-standard LAS files for all point cloud data. Quantum Spatial proprietary software was used to perform final statistical analysis of the classes in the LAS files, on a per tile level to verify final classification metrics and full LAS header April 25, 2019 Page 14 of 21New Hampshire 2016 LiDAR Project Project Report information. 3.5. Hydro-Flattened Breakline Creation Class 2 LiDAR was used to create a bare earth surface model. The surface model was then used to heads-up digitize 2D breaklines of Inland Streams and Rivers with a 100 foot nominal width and Inland Ponds and Lakes of 2 acres or greater surface area. Elevation values were assigned to all Inland Ponds and Lakes, Inland Pond and Lake Islands, Inland Streams and Rivers and Inland Stream and River Islands using TerraModeler functionality. Elevation values were assigned to all Inland streams and rivers using Quantum Spatial proprietary software. All ground (ASPRS Class 2) LiDAR data inside of the collected inland breaklines were then classified to water (ASPRS Class 9) using TerraScan macro functionality. A buffer of 3 feet was also used around each hydro flattened feature. These points were moved from ground (ASPRS Class 2) to Ignored Ground (ASPRS Class 10). The breakline files were then translated to Esri file geodatabase format using Esri conversion tools. 3.6. Hydro-Flattened Raster DEM Creation Class 2 LiDAR in conjunction with the hydro breaklines were used to create a 2.5-foot Raster DEM. Using automated scripting routines within ArcMap, a GeoTIFF file was created for each tile. Each surface is reviewed using Global Mapper to check for any surface anomalies or incorrect elevations found within the surface. 3.7. Intensity Image Creation GeoCue software was used to create the deliverable Intensity Images. All overlap classes (ASPRS class 17/18/25) were ignored during this process. This helps to ensure a more aesthetically pleasing image. The GeoCue software was then used to verify full project coverage as well. TIF/ TWF files were then provided as the deliverable for this dataset requirement. April 25, 2019 Page 15 of 21New Hampshire 2016 LiDAR Project Project Report Coverage verification was performed by comparing coverage of processed .LAS files captured during project collection to generate project shape files depicting boundaries of specified project areas. Please refer to Figure 6. 4. Project Coverage Verification April 25, 2019 Page 16 of 21New Hampshire 2016 LiDAR Project Project Report Figure 6. Flightline Swath LAS File Coverage April 25, 2019 Page 17 of 21New Hampshire 2016 LiDAR Project Project Report Quantum Spatial completed a field survey of 68 ground control (calibration) points along with 165 blind QA points in Vegetated and Non-Vegetated land cover classifications (total of 233 points) as an independent test of the accuracy of this project. A combination of precise GPS surveying methods, including static and RTK observations were used to establish the 3D position of ground calibration points and QA points for the point classes above. GPS was not an appropriate methodology for surveying in the forested areas during the leaf-on conditions for the actual field survey (which was accomplished after the LiDAR acquisition). Therefore the 3D positions for the forested points were acquired using a GPS-derived offset point located out in the open near the forested area, and using precise offset surveying techniques to derive the 3D position of the forested point from the open control point. The explicit goal for these surveys was to develop 3D positions that were three times greater than the accuracy requirement for the elevation surface. In this case of the blind QA points the goal was a positional accuracy of 5 cm in terms of the RMSE. For more information, see the Survey Report in Appendix B. The required accuracy testing was performed on the LiDAR dataset (both the LiDAR point cloud and derived DEM’s) according to the USGS LiDAR Base Specification Version 1.2 (2014). In this document, horizontal coordinates for ground control and QA points for all LiDAR classes are reported in NAD83 (2011), UTM Zone 19. 5.1. Calibration Control Point Testing Figure 7 shows the location of each bare earth calibration point for the project area. Note that the results of the surface calibration are not an independent assessment of the accuracy of these project deliverables, but the statistical results do provide additional feedback as to the overall quality of the elevation surface. 5.2. Point Cloud Testing The project specifications require that only Non-Vegetated Vertical Accuracy (NVA) be computed for raw lidar point cloud swath files. The required accuracy (ACCz) is: 19.6 cm at a 95% confidence level, derived according to NSSDA, i.e., based on RMSE of 10 cm in the “bare earth” and “urban” land cover classes. The NVA was tested with 95 checkpoints located in bare earth and urban (non-vegetated) areas. These check points were not used in the calibration or post processing of the lidar point cloud data. The checkpoints were distributed throughout the project area and were surveyed using GPS techniques. See survey report for additional survey methodologies. Elevations from the unclassified lidar surface were measured for the x,y location of each check point. Elevations interpolated from the lidar surface were then compared to the elevation values of the surveyed control points. AccuracyZ has been tested to meet 19.6 cm or better Non- 5. Ground Control and Check Point Collection April 25, 2019 Page 18 of 21New Hampshire 2016 LiDAR Project Project Report Vegetated Vertical Accuracy at 95% confidence level using RMSE(z) x 1.9600 as defined by the National Standards for Spatial Data Accuracy (NSSDA); assessed and reported using National Digital Elevation Program (NDEP)/ASRPS Guidelines. See Figure 8. 5.3. Digital Elevation Model (DEM) Testing The project specifications require the accuracy (ACCz) of the derived DEM be calculated and reported in two ways: 1. The required NVA is: 19.6 cm at a 95% confidence level, derived according to NSSDA, i.e., based on RMSE of 10 cm in the “bare earth” and “urban” land cover classes. This is a required accuracy. The NVA was tested with 95 checkpoints located in bare earth and urban (non-vegetated) areas. See Figure 8. 2. Vegetated Vertical Accuracy (VVA): VVA shall be reported for “brushlands/low trees” and “tall weeds/crops” land cover classes. The target VVA is: 29.4 cm at the 95th percentile, derived according to ASPRS Guidelines, Vertical Accuracy Reporting for Lidar Data, i.e., based on the 95th percentile error in all vegetated land cover classes combined. This is a target accuracy. The VVA was tested with 70 checkpoints located in forested, shrubland, and tall weed (vegetated) areas. The checkpoints were distributed throughout the project area and were surveyed using GPS techniques. See Figure 9. See survey report for additional survey methodologies. AccuracyZ has been tested to meet 19.6 cm or better Non-Vegetated Vertical Accuracy at 95% confidence level using RMSE(z) x 1.9600 as defined by the National Standards for Spatial Data Accuracy (NSSDA); assessed and reported using National Digital Elevation Program (NDEP)/ASRPS Guidelines. Category Target Measured Point Count Raw NVA 0.196 m 0.118 m 95 NVA 0.196 m 0.115 m 95 VVA 0.294 m 0.223 m 70 April 25, 2019 Page 19 of 21New Hampshire 2016 LiDAR Project Project Report Figure 7. Calibration Control Point Locations April 25, 2019 Page 20 of 21New Hampshire 2016 LiDAR Project Project Report Figure 8. QC Checkpoint Locations - NVA April 25, 2019 Page 21 of 21New Hampshire 2016 LiDAR Project Project Report Figure 9. QC Checkpoint Locations - VVA