Calendar Year 2019 CNEL Contours
Cessna 441 Conquest II · Performance
Overview
This document presents the Calendar Year 2019 CNEL (Community Noise Equivalent Level) contours for Santa Monica Municipal Airport (SMO). It details the methodology used to analyze airport noise exposure, including data from the airport's noise monitoring system and operational data from various aircraft types. The report is intended for stakeholders interested in understanding the noise impact of airport operations, including local residents and airport management. Key sections include an introduction to the noise exposure methodology, existing noise exposure data, and historical noise monitoring data, providing a comprehensive overview of the airport's noise environment during 2019.
- Total aircraft operations at SMO in 2019: 77,038 (3,064 jet, 70,680 propeller, 3,294 helicopter).
- Cessna 441 Conquest II operations: 1,147 in 2019.
- Noise monitoring system recorded CNEL levels ranging from 52.2 dB to 59.1 dB across six sites.
- The INM Version 7.0d was used for noise contour modeling.
- Daytime operations accounted for 92.9% of total operations.
Document
Source
Originally published by www.santamonica.gov. Sprinkle hosts a reference copy with an added summary, specifications and searchable full text.
Document details
- Type
- Performance
- Year
- 2019
- Pages
- 21
- File size
- 4.4 MB
- Publisher
- www.santamonica.gov
Common. Rarer than 2% of the aircraft models we track.
Most owners only have the POH. Here's the essential set for the Cessna 441 Conquest II.
- Pilot's Operating Handbook / AFM
- Checklist
- Maintenance Manual
- Parts Catalog (IPC)
- Systems & Wiring
- Service Bulletins
- Type Certificate (TCDS)
Cessna 441 Conquest II for sale now


Free — save the 441 Conquest II to your watchlist and track it in one place.
More Cessna 441 Conquest IImanuals & documents
See all 14 →- TECHNICAL PUBLICATIONS INDEXService Bulletins
- Annual Sound Study ReportOther Documents
- Supplemental Type Certificate Number STC SVA 528 Issue 3Supplemental Type Certificate
- HARTZELL PROPELLER INC. ALERT SERVICE BULLETIN HC-ASB-61-351 Propeller - Piston Unit ReplacementService Bulletins
- Minneapolis-St. Paul International Airport Long Term Comprehensive Plan UpdateTraining Manual
- Aviation Safety Letter TP 185E Issue 4/2010Training Manual
- Supplemental Inspection Documents (SID’s)Airworthiness Directives
- In-flight engine failure – 23 km N of Ardrossan, SA – 25 July 2007 – VH-OAA – Cessna Aircraft Company ‘Conquest II’ 441Service Bulletins
- CESSNA 441 CONQUEST IIPilot's Operating Handbook
- OPERATION & SERVICE MANUALChecklist
- Airworthiness Directive AD/TPE 331/59 Electronic Engine ControlsService Bulletins
- Cessna 441 Conquest II OperationsPilot's Operating Handbook
If you fly the Cessna 441 Conquest II, you may also be researching these.


In this document
Introduction
The introduction outlines the purpose of the report, which is to present the CNEL contours developed from 2019 operations and noise measurement data at Santa Monica Municipal Airport. It highlights the updated methodology reflecting current noise measurement practices.
Methodology
This section describes the methodology for assessing airport noise exposure, emphasizing the use of noise measurements and computer modeling. It details the INM (Integrated Noise Model) used to generate noise contours and the importance of accurate operational data.
Existing Airport Noise Exposure
This section provides an overview of the noise exposure around Santa Monica Municipal Airport, including the total number of aircraft operations in 2019, which totaled 77,038. It breaks down operations by aircraft type, including jet, propeller, and helicopter operations.
2019 Airport Operations Data
In 2019, the airport recorded 77,038 operations, comprising 3,064 jet operations, 70,680 propeller operations, and 3,294 helicopter operations. This section discusses the increase in operations compared to 2018 and defines local versus itinerant operations.
Airport Noise Monitoring Data
This section presents data from the airport's noise monitoring system, detailing CNEL measurements at various monitoring sites. It includes a comparison of measured versus modeled CNEL values, highlighting the accuracy of the noise modeling.
Full document text
` PRESENTED BY Landrum & Brown, Incorporated Calendar Year 2019 CNEL Contours Santa Monica Municipal Airport March 23, 2020 PREPARED FOR The City of Santa Monica Calendar Year 2019 CNEL Contours The City of Santa Monica March 23, 2020 Santa Monica Municipal Airport | i Contents Page 1 Introduction 1 2 Methodology 1 2.1 Background 1 2.2 Computer Modeling 1 3 Existing Airport Noise Exposure 2 3.1 Santa Monica Municipal Airport Background 2 3.2 2019 Airport Operations Data 2 3.3 Annual Operations and Airport Fleet Mix Data 4 3.4 Airport Runway and Flight Track Utilization 5 3.5 Airport Noise Monitoring Data 6 3.6 Airport Year 2019 CNEL Contours 9 4 Historical Noise Monitoring Data 11 5 References 12 Attachments 13 The City of Santa Monica Calendar Year 2019 CNEL Contours March 23, 2020 ii | Landrum & Brown List of Tables Page TABLE 3-1 SUMMARY OF 2019 OPERATIONS BY AIRCRAFT TYPE AT SMO 4 TABLE 3-2 CNEL MEASURED DURING CALENDAR YEAR 2019 AT SMO 6 TABLE 3-3 COMPARISON OF 2019 MEASURED CNEL TO MODELED CNEL AT SMO 9 TABLE 4-1 PRE-1988 CNEL MEASUREMENT DATA FOR SMO NMT 1 11 Calendar Year 2019 CNEL Contours The City of Santa Monica March 23, 2020 Santa Monica Municipal Airport | iii List of Figures Page FIGURE 1 NOISE MONITOR LOCATIONS AT SMO 3 FIGURE 3-2 FLIGHT TRACKS USED FOR INM MODELING NOISE EXPOSURE AT SMO 7 FIGURE 3-3 ENERGY AVERAGE SENEL BY AIRCRAFT TYPE AT SMO NMT 1 AND 2 8 FIGURE 3-4 YEAR 2019 CNEL CONTOURS AT SMO 10 FIGURE 4-1 HISTORY OF CNEL AT SMO NMT 1 – 4, 1989 – 2019 11 FIGURE A-1 SAMPLE OF SMO ARRIVAL RADAR TRACKS (AUG 11-17, 2019) 13 FIGURE A-2 SAMPLE OF SMO DEPARTURE RADAR TRACKS (AUG 11-17, 2019) 14 FIGURE A-3 SAMPLE OF SMO RADAR TRACKS (AUG 11-17, 2019) 15 Calendar Year 2019 CNEL Contours The City of Santa Monica March 23, 2020 Santa Monica Municipal Airport | 1 1 Introduction Year 2019 CNEL contours were developed using the calendar year 2019 operations and noise measurement data for the airport. The methodology used for the year 2019 CNEL contours has been updated to reflect current noise measurement data using the FAA noise model. This report contains four major sections including this introduction. Section 2 describes the methodology used for this report. Section 3 describes the existing noise exposure in the vicinity of Santa Monica Municipal Airport (SMO or Airport) including the 2019 CNEL contours. Section 4 presents historical CNEL measurement data for the Airport. 2 Methodology 2.1 Background The methodology used here for describing the existing airport noise exposure in terms of CNEL rely heavily on noise measurements made by the airport’s permanent noise monitoring system and computer noise modeling. The airport noise exposure is commonly depicted in terms of lines of equal CNEL noise levels, or noise contours. These noise contours are supplemented here with specific noise data for selected points on the ground. The computer noise model used here is described in the following section below. 2.2 Computer Modeling Noise contour modeling is a very key element of creating noise contours. Generating accurate noise contours is largely dependent on the use of a reliable, validated, and updated noise model. It is imperative that these contours be accurate for the meaningful analysis of airport noise. Airport noise contours were generated using the INM Version 7.0d. [1] The original INM was released in 1977. This version, INM Version 7.0d, was released for use in May 2013. The INM is a large computer program developed to plot noise contours for airports. The program is provided with standard aircraft noise and performance data for over 100 civilian aircraft types that can be tailored to the characteristics of the airport in question, as well as a database of military aircraft types. One of the most important factors in generating accurate noise contours is the collection of accurate operational data. The INM program requires the input of the physical and operational characteristics of an airport. Physical characteristics include runway coordinates, airport altitude, and temperature and optional topographical data. Operational characteristics include various types of aircraft data. This includes not only the aircraft types and flight tracks, but also departure and arrival procedures that are specific to the operations at an airport. Aircraft data needed to generate noise contours include: • Number of aircraft operations by type • Types of aircraft • Day/Evening/Night time distribution by type The City of Santa Monica Calendar Year 2019 CNEL Contours March 23, 2020 • Flight tracks • Flight track utilization by type • Flight profiles • Typical operational procedures • Average Meteorological Conditions 3 Existing Airport Noise Exposure 3.1 Santa Monica Municipal Airport Background Santa Monica Municipal Airport serves as a general aviation airport. The use of the Airport is heavily regulated as a result of its limited area and facilities, environmental sensitivity of the local area, and because of a long history of airport related litigation extending back at least to the 1960’s. The operation of SMO is regulated by Federal, State, and local laws and regulations including the 2017 Consent Decree. The Airport has a long history of noise analyses and was one of the very early airports to install a permanent noise monitoring system. Extensive data from its noise monitoring system enables accurate modeling and prediction of noise levels. Both CNEL and SENEL are monitored and calculated for each day and each aircraft operated at the Airport. CNEL data are collected at each of the six permanent Noise Monitoring Terminals (NMT or microphones), which are presented in Figure 3-1. The emphasis of the Airport noise abatement program is on regulating and limiting single event noise. This is in response to resident’s concerns about high noise levels associated with some aircraft
Show full textShow less
operations at the Airport. SMO is one of the very few airports that limit aircraft single event noise. Other airports that limit single event noise include John Wayne Airport, Long Beach Municipal Airport, Torrance Municipal Airport, and Hayward Air Terminal. Of these airports the noise limits vary and are difficult to compare because the location of the enforcement microphones at the various airports are not located in similar positions to the microphones at SMO. Estimating the noise limits at all these airports using a common microphone location indicates that the John Wayne Airport and Long Beach Municipal Airport are much less stringent than SMO (both include jet air carrier operations), Hayward Air Terminal is about 3 decibels (dB) less stringent than SMO and Torrance Municipal Airport noise limits are about the same as SMO. No airport has limits more stringent than SMO. 3.2 2019 Airport Operations Data Year 2019 aircraft operations at SMO totaled 77,038 of which some 3,064 were jet aircraft operations, 70,680 were propeller aircraft operations, and 3,294 were helicopter operations. These data were obtained from traffic counts kept by the FAA Air Traffic Control Tower and Airport staff. Note that an operation is defined as a takeoff or a landing. Therefore, 77,038 operations translate into 38,519 takeoffs and landings during the year. The total operations represent an increase in operations from the year 2018 of approximately 6.9%. The jet operations represent an increase of approximately 3.1% relative to the year 2018. Of the total operations, 48,644 were itinerant operations and 28,403 were local operations. “Local traffic” is defined as an aircraft that stayed within the Airport’s Class D controlled airspace, generally within 5 nautical miles of the airport or within the Airport traffic pattern. 2 | Landrum & Brown Calendar Year 2019 CNEL Contours The City of Santa Monica March 23, 2020 Santa Monica Municipal Airport | 3 When counting local operations, the departure part of the touch and go is counted as one operation and the landing part is counted as another operation. Figure 1 Noise Monitor Locations at SMO Source: SMO, L&B (2019) The City of Santa Monica Calendar Year 2019 CNEL Contours March 23, 2020 4 | Landrum & Brown 3.3 Annual Operations and Airport Fleet Mix Data The type of aircraft using the Airport were determined using the year 2019 flight information data from the Airport’s noise monitoring system that is known as Airport Noise and Operations Monitoring System (ANOMS). All aircraft noise events for all of the year 2019 were downloaded and analyzed by aircraft type, operation, and runway used. Not all of the aircraft types that fly at SMO are represented in the INM. The INM uses substitute aircraft to represent similar aircraft types. Table 3-1 lists the aircraft types that were recorded at SMP, the INM substitution used to model that aircraft, and the corresponding number of operations per aircraft type. The annual operations data were then summarized by aircraft type using the INM aircraft types available. Aircraft types were divided into Aircraft Categories including General Aviation (GA) Jets, GA Single Propeller (Prop), GA Twin Prop, and Helicopters. Table 3-1 presents a summary of the annual operations by aircraft type used in the noise modeling. Note that the airport noise monitoring system does not record all flights and some flights are labeled as ‘unknown’ if the aircraft is flying under visual flight rules (VFR) and does not broadcast its identification. The single engine propeller aircraft operations were adjusted to increase these operations in order to replicate the total operations as reported by the FAA Tower in its annual operations report. Table 3-1 Summary of 2019 Operations by Aircraft Type at SMO Aircraft Type Aircraft Category INM Equivalent Number of Operations Gulfstream 280 GA Jet CL600 143 Cessna 500 Citation I GA Jet CNA500 422 Cessna 525 CitationJet GA Jet CNA510 94 Cessna 550 Citation II GA Jet CNA525C 242 Embraer Phenom 300 GA Jet CNA55B 1800 Cessna 560 Citation V GA Jet CNA560U 166 Cessna 560 Citation XLS GA Jet CNA560XL 16 Cessna 680 Citation Sovereign GA Jet CNA680 55 Falcon 50 GA Jet F10062 111 Falcon 8X GA Jet GIV 2 Beechcraft Premier I GA Jet LEAR35 13 GA Jet Subtotal 3,064 Cessna 172 Skyhawk GA Single Prop CNA172 4,864 Cessna 206 GA Single Prop CNA206 36 Cessna 208 Caravan GA Single Prop CNA208 1,643 Piper Sports Cruiser (Itinerant) GA Single Prop COMSEP 5,696 Piper Sports Cruiser (Local) GA Single Prop COMSEP 14,201 Cirrus SR 22 / GA Single Engine Fixed-Pitch Prop (Itinerant) GA Single Prop GASEPF 22,232 Calendar Year 2019 CNEL Contours The City of Santa Monica March 23, 2020 Santa Monica Municipal Airport | 5 Aircraft Type Aircraft Category INM Equivalent Number of Operations Cirrus SR22 / GA Single Engine Fixed- Pitch Prop (Local) GA Single Prop GASEPF 14,202 GA Single Engine Variable-Pitch Prop GA Single Prop GASEPV 2,245 Beech Baron GA Twin Prop BEC58P 1,695 Cessna 441 Conquest II GA Twin Prop CNA441 1,147 Raytheon Super King Air 200 GA Twin Prop DHC6 2,719 GA Prop Subtotal 70,680 Agusta A-109 Helicopter A109 203 Bell 206 JetRanger Helicopter B206L 284 Bell 407 Helicopter B407 111 Bell 429 Helicopter B429 387 Eurocopter EC-130 Helicopter EC130 289 Hughes 500D Helicopter H500D 179 Robinson R44 Raven Helicopter R44 943 Sikorsky S-76 Spirit Helicopter S76 326 Aerospatiale SA-350D Astar Helicopter SA350D 572 Helicopter Subtotal 3,294 Total Operations 77,038 Source: SMO, L&B (2020) 3.4 Airport Runway and Flight Track Utilization The flight tracks at SMO are well established to take advantage of the runway configuration and prevailing wind conditions. Runway 3/21 is approximately 3,500 feet long and is the only runway at the Airport. With winds predominantly coming from the ocean, aircraft typically depart to the west and arrive from the east on Runway 21. Only during Santa Ana wind conditions or other winds that move toward the ocean does the flow reverse with departures to the east and arrivals from the west. East flow occurred approximately five (5) percent of the time in 2019. Departures to the west are grouped into two major tracks. Small aircraft doing visual departures follow a track that proceeds over the golf course and pilots are instructed to not turn prior to Lincoln Boulevard to the south and the shoreline to the north or east. Larger aircraft doing instrument departures proceed straight along the extended runway centerline. All business jets were modeled on the straight out departure. These aircraft are generally doing an Instrument Flight Rules (IFR) departure and are instructed to fly runway heading departures. Arrivals are from the east and are on a straight in track by the time they get within the Airport environs. The local pattern is a left hand pattern. Helicopter departures use the runway heading departure similar to fixed wing aircraft and helicopter arrivals are from the north and south of SMO. INM flight tracks are presented on Figure 3-2. The tracks were refined using radar data collected from the airport’s noise monitoring system. Sample radar tracks are The City of Santa Monica Calendar Year 2019 CNEL Contours March 23, 2020 6 | Landrum & Brown attached to this report. When winds dictate flow to the east, the aircraft are assumed to operate on straight in and straight out flight tracks. The day/evening/night distribution of operations was derived from noise monitoring system data for the year 2019. The data logs show 92.9 percent of the operations during daytime hours (7 am to 7 pm), 6.3 percent during the evening hours (7 pm to 10 pm), and 0.8 percent of the operations during the night hours (10 pm to 7 am). 3.5 Airport Noise Monitoring Data The remote monitoring sites were shown in Figure 3-1. The CNEL measured at each of these sites during calendar year 2019 are shown in Table 3-2. Table 3-2 CNEL Measured During Calendar Year 2019 at SMO Site 2019 CNEL (dB) 1 56.2 2 52.2 3 54.4 4 54.5 5 58.1 6 59.1 Source: SMO (2020) The noise monitoring system data were reviewed by aircraft type to determine the single event noise levels associated with each aircraft type. This was done using 2019 Airport operations and noise data in order to develop aircraft flight profiles needed to use in the INM in order to get noise model results to match noise measurement results. Because of the strict noise limits at SMO, aircraft generally use procedures that are not represented by the typical aircraft flight procedures that are contained in the INM. Figure 3-3 presents the results of the SENEL analysis by aircraft type for noise measurements made at site NMT 1 for aircraft departures and site NMT 2 for aircraft arrivals. Note that the quantity shown is the energy average SENEL. Energy average is a form of averaging used for logarithmic data such as decibels. The energy average is biased towards the higher values in a distribution. For example, the more typical arithmetic average of the two numbers 50 and 100 is a value of 75. But the energy average of the decibel values 50 and 100 results in an energy average of 97 decibels. Note also that in computing the averages, the number used for the sample size was the actual number of measured noise events plus the number of flights that were tracked but did not generate a noise event. For the flights that did not generate a noise event, an assumed SENEL was included that was based on the loudest an aircraft could be without triggering a noise event in the noise monitoring system. Note also that aircraft types shown in Figure 3-3 represent the aircraft indicated plus all the aircraft for which this aircraft was the INM substitute. For example, the noise level for the aircraft shown as the CNA55B included the C550, E50P, and the E55P aircraft. Calendar Year 2019 CNEL Contours The City of Santa Monica March 23, 2020 Santa Monica Municipal Airport | 7 Figure 3-2 Flight Tracks Used for INM Modeling Noise Exposure at SMO Source: SMO, L&B (2020) The City of Santa Monica Calendar Year 2019 CNEL Contours March 23, 2020 8 | Landrum & Brown Figure 3-3 Energy Average SENEL by Aircraft Type at SMO NMT 1 and 2 Source: SMO, L&B (2020) Calendar Year 2019 CNEL Contours The City of Santa Monica March 23, 2020 Santa Monica Municipal Airport | 9 3.6 Airport Year 2019 CNEL Contours The CNEL contours used to depict existing noise exposure at SMO were developed using the INM Version 7.0d. The 60, 65 and 70 dB CNEL contours are presented in Figure 3-4. Table 3-3 compares the measured CNEL with the CNEL predicted by the INM model at the six (6) measurement NMT. Table 3-3 Comparison of 2019 Measured CNEL to Modeled CNEL at SMO NMT Measured CNEL (dB) Modeled CNEL (dB) 1 56.2 56.2 2 52.2 52.9 3 54.4 54.5 4 54.5 54.4 5 58.1 58.3 6 59.1 58.1 Source: SMO, L&B (2020) The difference between measured versus modeled results is less than 0.7 dB sites 1, 2, 3, 4, and 5. For Site 6, the measured noise level is 1.0 dB higher than the modeled noise level, which is likely due to aircraft noise events and community noise events occurring simultaneously. Some caution is warranted when reviewing the noise contours. The noise contours at the east end of the airport are shaped by two (2) types of operations, arrivals to Runway 21 and noise aft of the aircraft generated during departure on Runway 21. The noise generated aft of the aircraft during pre-takeoff engine run and takeoff roll is modeled in the INM using a generic aircraft directional pattern that may or may not be representative of the aircraft that operate at SMO. The City of Santa Monica Calendar Year 2019 CNEL Contours March 23, 2020 10 | Landrum & Brown Figure 3-4 Year 2019 CNEL Contours at SMO Source: L&B (2020) Calendar Year 2019 CNEL Contours The City of Santa Monica March 23, 2020 Santa Monica Municipal Airport | 11 4 Historical Noise Monitoring Data The original noise monitoring system was installed in the 1970’s and replaced in 1988, and 2017. The historical CNEL data from the existing system are plotted in Figure 4-1. Note that the apparent increase in noise level in 2011 is due to both an increase in jet and propeller operations from the year 2010 to 2011 as well as retuning of the noise event filter in the noise monitoring system. Since 2012, the noise levels have stabilized or decreased as a result of reduced operations. CNEL measurements recorded prior to 1988 are available and were reported occasionally. Data for the years 1982, 1983, 1985 and 1987 were found for Site 1. These are listed in Table 4-1. Table 4-1 Pre-1988 CNEL Measurement Data for SMO NMT 1 Year CNEL (dB) 1982 62.1 1983 61.5 1985 58.8 1987 57.9 Source: L&B (2020) Figure 4-1 History of CNEL at SMO NMT 1 – 4, 1989 – 2019 Source: SMO, L&B (2020) The City of Santa Monica Calendar Year 2019 CNEL Contours March 23, 2020 12 | Landrum & Brown 5 References 1. U.S. Department of Transportation, Federal Aviation Administration, "Integrated Noise Model (INM) Version 7.0 User's Guide," April, 2007. Calendar Year 2019 CNEL Contours The City of Santa Monica March 23, 2020 Santa Monica Municipal Airport | 13 Attachments Figure A-1 Sample of SMO Arrival Radar Tracks (Aug 11-17, 2019) Source: SMO (2020) The City of Santa Monica Calendar Year 2019 CNEL Contours March 23, 2020 14 | Landrum & Brown Figure A-2 Sample of SMO Departure Radar Tracks (Aug 11-17, 2019) Source: SMO (2020) Calendar Year 2019 CNEL Contours The City of Santa Monica March 23, 2020 Santa Monica Municipal Airport | 15 Figure A-3 Sample of SMO Radar Tracks (Aug 11-17, 2019) Source: SMO (2020). Note: The above graphic includes SMO Arrival, Departures, and Overflights from other airports.
59 Cessna 441 Conquest II parts for sale
See all →


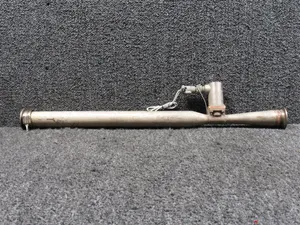
Parts listed for sale by vetted eBay sellers — confirmed on eBay at checkout.