Horsepower vs. Weight Graphing Activity
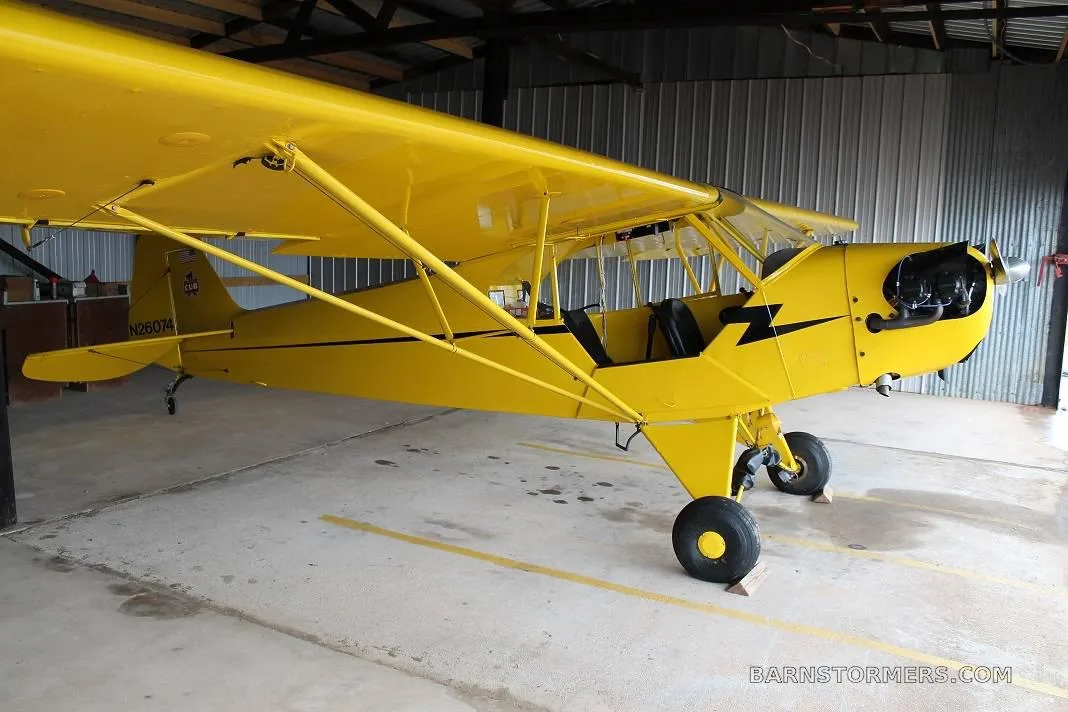
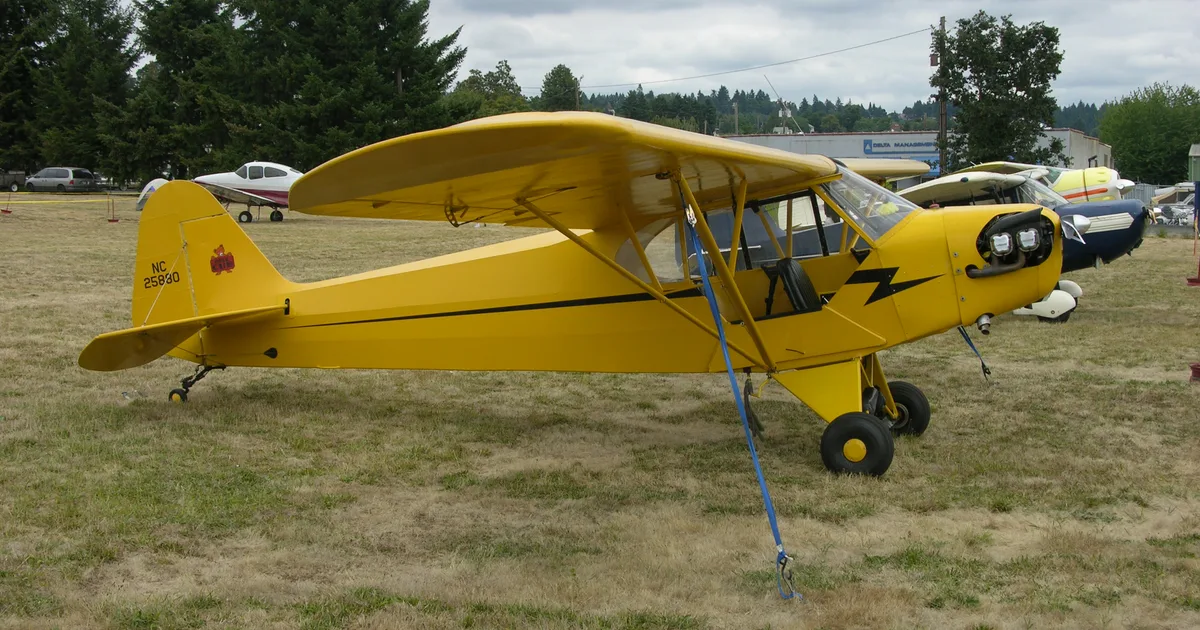
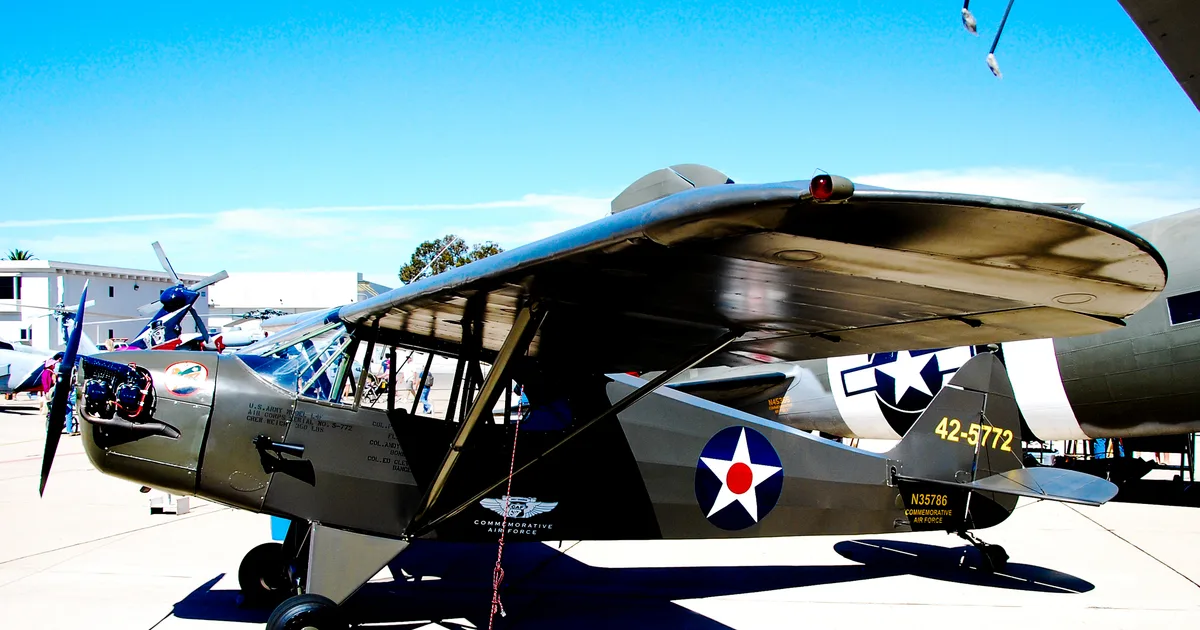
Piper J-3 Cub · Specifications
Overview
This document provides a detailed analysis of the horsepower and weight specifications for various aircraft, with a focus on the Piper J-3 Cub. It includes a chart for recording horsepower and empty weight, allowing users to graph the relationship between these two critical performance metrics. The document is designed for educational purposes, particularly for those interested in understanding the dynamics of aircraft performance. It encourages users to explore the specifications of different planes and analyze how horsepower relates to weight, using the Piper J-3 Cub as a primary example.
- Piper J-3 Cub has a horsepower of 65 HP and an empty weight of 640 lbs.
- Graphing horsepower against weight helps visualize performance relationships.
- Understanding the relationship between horsepower and weight is essential for evaluating aircraft performance.
Summary written by AI from the source document. Check the original before relying on it. See which parts of Sprinkle are written by AI.
Reference only, not for flight. Use the current approved manual for your aircraft. See terms, section 5.
Document
Source
Copy found at lonestarflight.org. Sprinkle hosts a reference copy with an added summary, specifications and searchable full text.
Document details
- Type ·
- Specifications
- Pages ·
- 4
- File size ·
- 229 KB
- Copy found at ·
- lonestarflight.org
What is the Horsepower vs. Weight Graphing Activity?
The Horsepower vs. Weight Graphing Activity is a specifications for the Piper J-3 Cub.
How many pages is the Horsepower vs. Weight Graphing Activity?
The copy of the Horsepower vs. Weight Graphing Activity on file runs 4 pages.
Common. More common than 99% of the aircraft models we track.
Most owners only have the POH. Here's the essential set for the Piper J-3 Cub.
- Pilot's Operating Handbook / AFM
- Checklist
- Maintenance Manual
- Parts Catalog (IPC)
- Systems & Wiring
- Service Bulletins on file
- Type Certificate (TCDS)
Piper J-3 Cub for sale now


Free — save the J3C to your watchlist and track it in one place.
More Piper J-3 Cubmanuals & documents
See all 21 →- Piper J-3 Cub Model GuideModel Guide
- J-3 Cub 10cc Instruction ManualPilot's Operating Handbook
- Piper J-3 Cub User GuideWeight & Balance
- NORMAL PROCEDURES Piper Cub J-3/L-4 – HB-OENChecklist
- Type Acceptance Report TAR 20/21B/8 – Piper J3L SeriesOther Documents
- Ultra-Micro J-3 Cub RTF & BNF Instruction ManualChecklist
- Supplemental Type CertificateSupplemental Type Certificate
- J-3 Cub BL Instruction ManualMaintenance Manual
- PIPER J3 CUB - 1937- 47Specifications
- Pilot's Operating Handbook for the Piper J-3 CubPilot's Operating Handbook
- WEIGHT & BALANCE WORK SHEETWeight & Balance
- PIPER J3 CUB CHECKLISTPilot's Operating Handbook
Related documents
- ABS/BPPP Guide to Initial Pilot Checkout Appendix: Using Performance ChartsBeechcraft F33A Bonanza · Training Manual
- Cessna 150/Lycoming O-320-E2D Limited Performance EvaluationCessna 150 · Performance Data
- Performance Data for the Piper PA-11 Cub SpecialPiper PA-11 Cub Special · Performance Data
- Performance Data for the Piper PA-28 CadetPiper PA-28 Cadet · Performance Data
- Normal Procedures for the CESSNA 172M SKYHAWKCESSNA 172M SKYHAWK · Normal Procedures
If you fly the Piper J-3 Cub, you may also be researching these.




In this document
Horsepower and Weight Data
The document lists the horsepower and empty weight for the Piper J-3 Cub as 65 HP and 640 lbs, respectively. This data is crucial for understanding the performance capabilities of the aircraft in comparison to others.
Graphing Activity
Users are instructed to graph the horsepower against the weight of various aircraft, including the Piper J-3 Cub. This visual representation helps in analyzing the relationship between these two factors across different models.
Analysis Questions
The document poses several questions aimed at encouraging critical thinking about the data collected. Questions focus on identifying patterns in the data, understanding the implications of horsepower relative to weight, and comparing different aircraft.
Summary written by AI from the source document. Check the original before relying on it. See which parts of Sprinkle are written by AI.
Full document text
Horsepower vs. Weight Graphing Activity As you tour the plane hangars, read the Specification section of the information panels to find the Horsepower and Empty Weight of each aircraft. Record this information in the chart and graph it by placing a dot at the intersection of the HP and weight. Plane HP Weight Plane HP Weight Piper J-3 Cub SBD Dauntless Anderson- Greenwood AG-14 B25 Mitchell X 2 = Beechcraft Baron X 2= TBM-3E Avenger Stearman PT-17 Kaydet DC-3A X 2 = SNJ T-6 Texan F4U Corsair Horsepower and Weight of Airplanes 5,000 4,750 4,500 4,250 4,000 3,750 3,500 3,250 3,000 2,750 2,500 2,250 2,000 1,750 1,500 1,250 1,000 750 500 250 5,000 10,000 15,000 20,000 25,000 30,000 35,000 Empty Weight (lbs) Horsepower is the amount of force an engine creates. Weight is the force of attraction to the Earth. Horsepower Horsepower vs. Weight Graphing Questions After recording and graphing your horsepower and weight data, answer these questions. Horsepower is the force an engine creates to push the plane forward. Larger engines create more horsepower and are needed for heavier or faster planes. 1. Do the data points fall in a pattern, or are they random? 2. What shape do the data points form? 3. What does this tell you about the relationship between horsepower (force) and weight of airplanes? 4. Find the point for the DC-3. Does it fit into the pattern? 5. Go look at the DC-3 (large silver plane) Do you think the difference in the DC-3 that shows on the graph is an advantage, or a disadvantage? a. The data graph shows that a DC-3 has (more / less) horsepower than a typical plane with the same weight. b. If the DC-3 was a typical plane, its horsepower would be around . c. It has (more / less) horsepower because the engines are (smaller/ larger), so it uses (more/ less) fuel, and this is an (advantage / disadvantage). d. What words would you use to describe the DC-3? 6. Find the points for the A-1D Skyraider and the B-17 Flying Fortress. These planes did the same job and could carry the same bomb loads, but the Skyraider was designed about 10 years after the B-17 was used in World War II. What does the data graph tell you about technology in the 10 year difference? 7. Why is it helpful to show information in charts or graphs? Horsepower vs. Weight Graphing Activity As you tour the plane hangars, read the Specification section of the information panels to find the Horsepower and Empty Weight of each aircraft. Record this information in the chart and graph it by placing a dot at the intersection of the HP and weight. Plane HP Weight Plane HP Weight Piper J-3 Cub 65 640 SBD Dauntless 1,200 6,535 Anderson- Greenwood AG-14 90 850 B25 Mitchell 1700 x 2 = 3400 19,480 Beechcraft Baron 285 X 2 = 570 3,085 TBM-3E Avenger 1,900 10,545 Stearman PT-17 Kaydet 220 1,936 DC-3A 1000 X 2 = 2000 16,865 SNJ Texan 600 4,185 F4U Corsair 2,300 9,803 Horsepower and Weight of Airplanes 5,000 4,750 4,500 4,250 4,000 3,750 3,500 3,250 3,000 2,750 2,500 2,250 2,000 1,750 1,500 1,250 1,000 750 500 250 5,000 10,000 15,000 20,000 25,000 30,000 35,000 Empty Weight (lbs) Horsepower is the amount of force an engine creates. Weight is the force of attraction to the Earth. Horsepower Horsepower vs. Weight Graphing Questions After recording and graphing your horsepower and weight data, answer these questions. Horsepower is the force an engine creates to push the plane forward. Larger engines create more horsepower and are needed for heavier or faster planes. 1. Do the data points fall in a pattern, or are they random? The data points form a pattern 2. What shape do the data points form? They form a curved line 3. What does this tell you about the relationship between horsepower (force) and weight of airplanes? As weight increases, horsepower also increase. 4. Find the point for the DC-3. Does it fit into the pattern? No. 5. Go look at the DC-3 (large silver plane) Do you think the difference in the DC-3 shows an advantage, or a disadvantage? a. The data graph shows that a DC-3 has (more / less) horsepower than a typical plane with the same weight. b. If the DC-3 was a typical plane, its horsepower would be around 3,200 . c. It has (more / less) horsepower because the engines are (smaller/ larger), so it uses (more/ less) fuel, and this is an (advantage / disadvantage). d. What words would you use to describe the DC-3? Efficient, better, advantageous, etc. 6. Find the points for the A-1D Skyraider and the B-17 Flying Fortress. These planes did the same job and could carry the same bomb loads, but the Skyraider was designed about 10 years after the B-17 was used in World War II. What does the data graph tell you about technology in the 10 year difference? In the 10 years planes were developed to have more horsepower with less weight 7. Why is it helpful to show information in charts or graphs? It is easier to compare information when is it shown in a visual way instead of just text. You can see which things are the same and what is different.