Validation Report
Cirrus SR20 · Other Documents
Overview
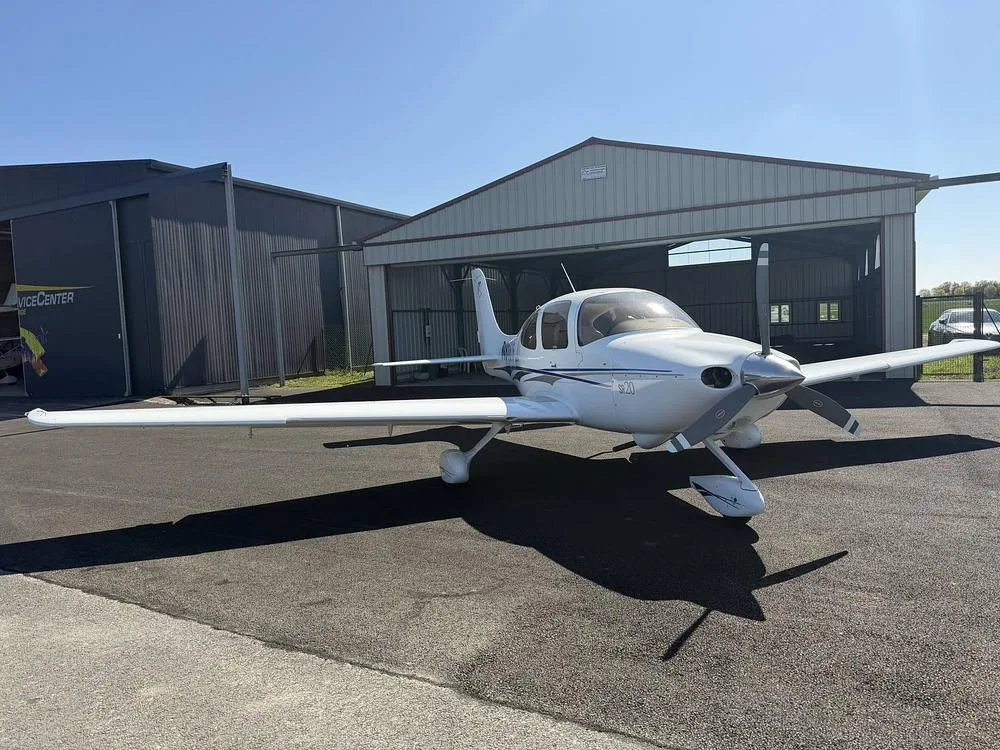
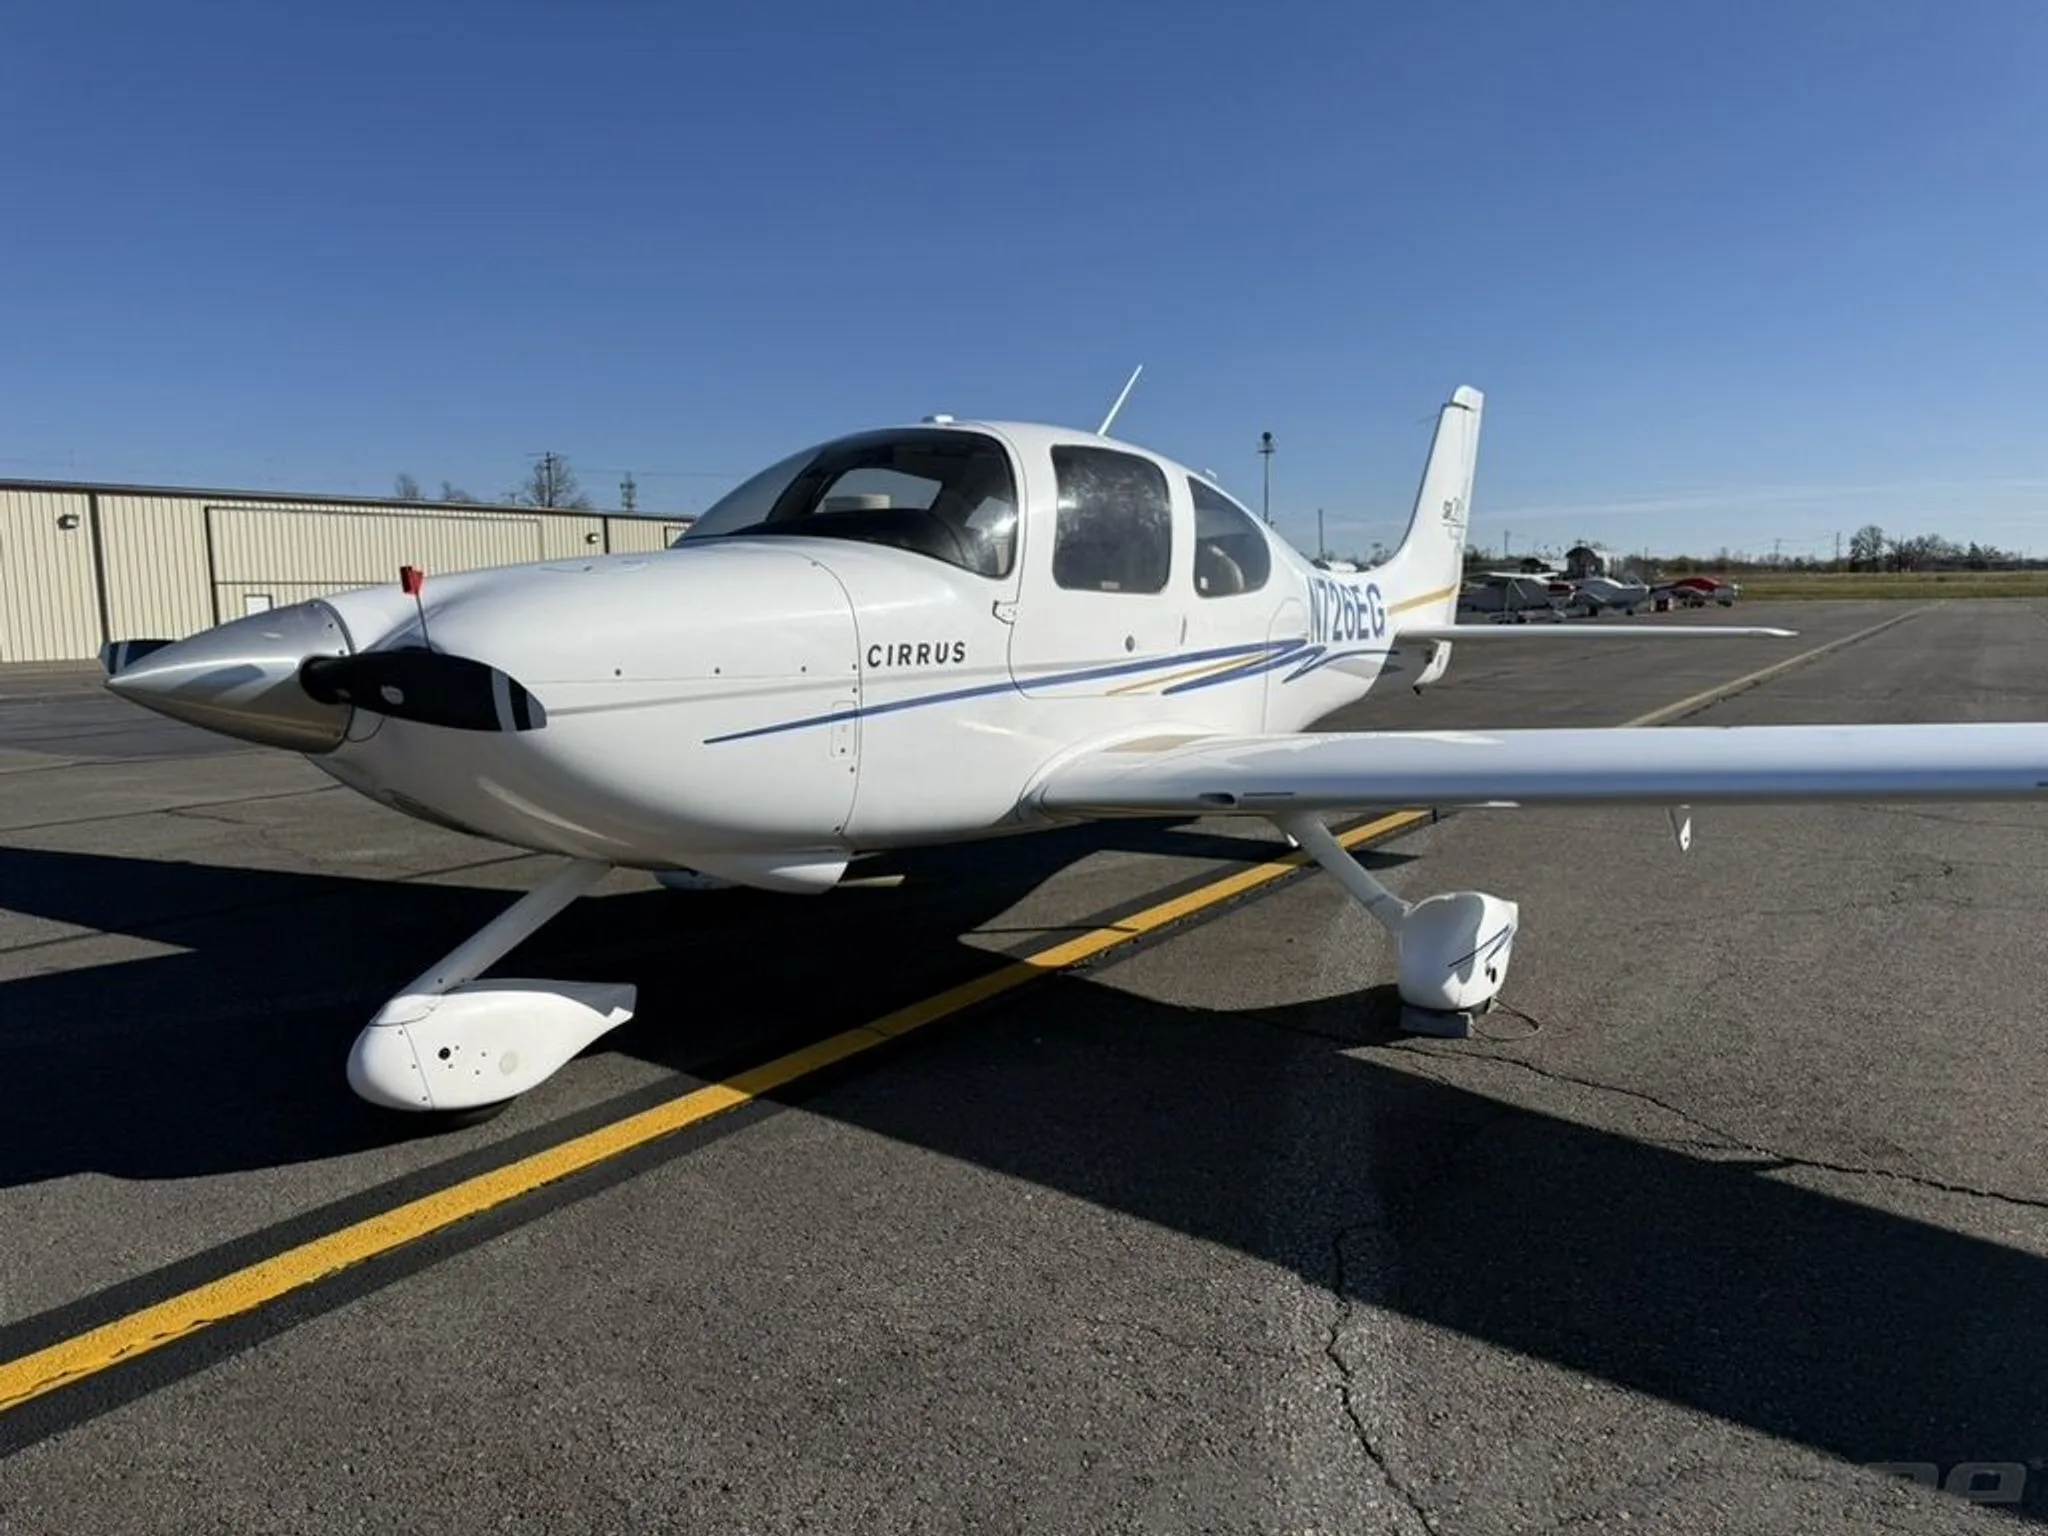
This Validation Report focuses on the Cirrus SR20 and aims to assess the accuracy of the Aircraft Design Software (ADS) algorithms in modeling the aircraft's performance. The report compares flight test measurements with ADS modeling results, using data from the Pilot's Operating Handbook and the Type Certificate Data Sheet. Key aspects analyzed include drag efficiency, lift efficiency, mass efficiency, stall speeds, takeoff distances, maximum rate of climb, cruise speeds, and landing distances. The report provides detailed tables and calculations to illustrate the performance characteristics of the Cirrus SR20 under various flight conditions, making it a valuable resource for engineers and pilots seeking to understand the aircraft's performance metrics.
- The Cirrus SR20 has a maximum lift coefficient (ClMx) of 1.34 (FM) and 1.43 (ADS).
- Stall speed with flaps up is 128 km/h (FM) and 127 km/h (ADS).
- Takeoff distance at sea level for a weight of 1429 kg is 514 m (FM) and 527 m (ADS).
- The maximum rate of climb (RCMx) is 4.39 m/s (FM) and 4.40 m/s (ADS) at a weight of 1429 kg.
- Cruise speed at 610 m altitude and 90% power setting is 289 km/h (FM) and 292 km/h (ADS).
Document
Source
Originally published by www.pca2000.com. Sprinkle hosts a reference copy with an added summary, specifications and searchable full text.
Document details
- Type
- Other Documents
- Year
- 2021
- Pages
- 9
- File size
- 352 KB
- Publisher
- www.pca2000.com
Common. One of the most common aircraft types we track.
Most owners only have the POH. Here's the essential set for the Cirrus SR20.
- Pilot's Operating Handbook / AFM
- Checklist
- Maintenance Manual
- Parts Catalog (IPC)
- Systems & Wiring
- Service Bulletins
- Type Certificate (TCDS)
Cirrus SR20 for sale now

Free — save the SR20 to your watchlist and track it in one place.
More Cirrus SR20manuals & documents
See all 17 →- DFC Autopilot Series Installation ManualWiring Diagram
- Cirrus Owners and Pilots Quick Reference Guide for SR Series aircraftV Speeds Reference
- PILOT’S OPERATING HANDBOOK AND FAA APPROVED AIRPLANE FLIGHT MANUAL for the CIRRUS DESIGN SR20Pilot's Operating Handbook
- Standard Practice Maintenance ManualMaintenance Manual
- Aviation Maintenance Alert - Cirrus SR20 and SR22 AircraftMaintenance Manual
- PILOT’S OPERATING HANDBOOK AND FAA APPROVED AIRPLANE FLIGHT MANUAL for the CIRRUS SR20Training Manual
- CIRRUS SR20 NORMAL CHECKLISTEmergency Procedures
- Dual Fuel Level – Cirrus Aircraft w/ CIES Inc. SendersWiring Diagram
- Pilot’s Operating HandbookPilot's Operating Handbook
- Service BulletinService Bulletins
- AIRWORTHINESS DIRECTIVEAirworthiness Directives
- SERVICE BULLETIN SB 7084Service Bulletins
If you fly the Cirrus SR20, you may also be researching these.


In this document
Methodology
The validation process consists of three main steps: reverse engineering the aircraft to create a 3D model, calculating the aircraft's performance under different flight conditions, and presenting the results for analysis. This structured approach ensures a comprehensive evaluation of the aircraft's aerodynamic and performance characteristics.
Performance Analysis
The performance analysis section computes various performance metrics for the Cirrus SR20, including stall speeds, takeoff distances, maximum rate of climb, cruise speeds, and landing distances. Each metric is calculated based on specific flight conditions, such as weight, altitude, power settings, and center of gravity positions.
Drag and Lift Efficiency
The report details the drag efficiency through computed coefficients for different altitudes and power settings. It also discusses lift efficiency, comparing maximum lift coefficients from the ADS with theoretical values, highlighting discrepancies and efficiencies.
Takeoff and Landing Performance
Takeoff and landing distances are calculated based on various parameters including runway conditions, headwind speeds, and flap settings. The report provides tables comparing computed values with those from the flight manual, indicating the accuracy of the ADS predictions.
Stall Speed Analysis
Stall speeds are computed for both flaps up and down configurations, with comparisons made to values from the flight manual. The analysis includes adjustments for maximum lift coefficients to ensure accurate predictions.
Full document text
Validation Report Copyright(c) 2007-2021 Optimal Aircraft Design srl (OAD) - All rights reserved 1/9 Airplane Cirrus SR20 ADS V433 Introduction The goal of the validation process is to determine the accuracy of the ADS’s algorithms to model an airplane of a given configuration. Validation consists in comparing the results of a series of measurements made during flight tests (FT) on a particular aircraft with the results of modelling carried out with the ADS software on the same aircraft (ADS). If no flight test results are available, the data are taken from the flight manual (FM) and from the Type Certificate Data Sheet (TCDS) The algorithms used to compute the aerodynamic, weight and balance, stability and performance are described at the end of this report. Figure 1 – Cirrus SR20 – long span (11.67 m) Figure 2 – Cirrus SR20 3D model Methodology The analysis takes place in 3 steps: • Step 1: make the reverse engineering of the aircraft • Step 2: calculate the performance of the aircraft for different flight conditions • Step 3: present and comment the results List of assumptions - Wing incidence: 3° - Wing Center of Gravity (CG) 40% - Wing airfoil profile: Roncz-Marske 7 - Horizontal tail airfoil profile: NACA-0009 - Vertical tail airfoil profile: NACA-0009 - Airplane CG position 27% List of references - Pilot’s Operating Handbook and FAA Approved Airplane Flight Manual Cirrus SR20 (2020) - EASA Type Certificate for Cirrus SR20, SR22 and SR22T Validation Report Copyright(c) 2007-2021 Optimal Aircraft Design srl (OAD) - All rights reserved 2/9 Reverse Engineering The reverse analysis consists to generate the 3D-Model of the aircraft and to specify its characteristics and performance. The aircraft will then be analyzed in detail in order to determine its mass efficiency and its aerodynamic efficiency for different flight conditions. A large number of statistics data will be generated. Results Drag efficiency From the reverse engineering, the equivalent friction drag coefficient (Cfe) and the interference drag coefficient (Cdint) have been computed for different altitudes (Alt) and power settings (PS), as shown in Table 1. Table 1 – Flight parameters for cruise condition PS [%] Alt [m] Vcr[km/h] Cfe Cdint 90 610 289 0.00545 19.1 84 1219 287 0.00547 18.6 78 1829 285 0.00544 17.6 72 2438 282 0.00544 16.9 67 3048 278 0.00561 18.7 62 3658 272 0.00578 20.4 57 4267 267 0.00581 20.2 Lift efficiency The lift efficiency is the ratio between the maximum lift coefficient (ClMx) computed from the stall speed performance flaps up and the maximum lift coefficient computed from the theory taking into account the wing geometry. The high lift device efficiency is the ratio between the maximum lift increment (ClMx) computed from the stall speed performance flaps down and the maximum lift increment computed from the theory taking into account the flap type and geometry. Lower than 1 means that the theory overestimates the value. Table 2 – Lift efficiency FM ADS [%] ClMx 1.34 1.43 97.2 ClMx 0.44 0.42 105.1 Mass efficiency The mass efficiency (MCF) is the ratio between the empty weight given by the manufacturer and the empty weight computed from the theory taking into account the geometry of every components of the aircraft. The theory makes the assumption that the aircraft is build with light alloy. The MCF takes into account the material but also the ability of the manufacturer to build a light structure, or not. MCF higher than 1 means that the aircraft is heavier than it should be if built with light alloy and optimized in weight. Table 3 – Mass efficiency MCF 1.27 Validation Report Copyright(c) 2007-2021 Optimal Aircraft Design srl (OAD) - All rights reserved 3/9 Performance Analysis The performance analysis consists to compute the performance of the aircraft for a specific flight condition. A flight condition is defined by the flight weight, the flight altitude, the power setting and the CG position. The total zero lift drag is computed from the interference drag coefficient which is supposed to be the same (16.9) for every flight conditions (Cruise, Takeoff (TO), Landing (Ld), Maximum Rate of Climb (RCMx)). Stall The stall speeds (Vs) are calculated by ADS and compared with the stall speeds given in the flight manual for a specific flight condition. The stall speeds with flaps up and down computed by ADS and given by the flight manual are presented in Table 4. A first fudge factor (FFClMx) is used for the flaps up flight condition to taking into account that the maximum lift coefficient of the lift curve generated by XFoil is most of the time overestimated. The second fudge factor (FFΔClMx) is used for the flaps down condition to adjust the maximum lift increment due to the flap deflection. The magnitude of both fudge factors is determined from reverse engineering and is considered to be 0.972 for the first one and 1.05 for the second in the current airplane. Table 4 – Vs @ 1429kg, CG @ 27% MAC, Alt @ SL, FFClMx=0.972 and FFΔClMx =1.05 FM ADS Δ [%] Vs flaps up [km/h] 128 127 -0.8 Vs flaps down 100% [km/h] 111 113 1.8 Validation Report Copyright(c) 2007-2021 Optimal Aircraft Design srl (OAD) - All rights reserved 4/9 Takeoff The takeoff is calculated according to the runway slope and surface, headwind speed (HW), flap deflection (Flap dflct), CG position, flight weight and rotation time (Rot. T). The takeoff distance computed by ADS and given by the flight manual are presented in Table 5 for an asphalt runway. Table 5 – Takeoff Distance considering Rot. T=2s and Flap dflct =16° FM ADS Δ Rwy alt [m] Mass [kg] HW [km/h] VLO [km/h] Rot. T [s] TO Run [m] TO Run [m] TO Run [%] 0 1429 0 139 2 514 527 0.6 0 1429 22 139 2 462 456 -1.3 0 1179 0 128 2 312 360 15.4 0 1179 22 128 2 281 316 12.5 914 1429 0 145 2 654 633 -3.2 914 1429 22 145 2 589 561 -4.8 914 1179 0 134 2 397 437 10.1 914 1179 22 134 2 358 385 7.5
Show full textShow less
The deviation is higher for a lighter flight weight and overall it decreases when headwind is added. The rotation time should be within a range of values (1s to 3s) according to the literature and should be adjusted for a given aircraft in order to obtain a good accuracy in the takeoff distance. The value chosen will be the same for every takeoff since it is assumed that the force applied on the elevator by the pilot is the same. An explanation for the large deviation when the flight weight is reduced can be that a given aircraft with a lighter weight might rotate faster than if it has a heavier weight since it reacts faster to pilot’s inputs. Validation Report Copyright(c) 2007-2021 Optimal Aircraft Design srl (OAD) - All rights reserved 5/9 Maximum Rate of Climb The RCMx and its associated flight speed (Vy), are presented in Table 6 for a flight weight of 1429kg and in Table 7Erreur ! Source du renvoi introuvable. for a flight weight of 1179kg. Table 6 – RCMx @ 1429kg, CG @ 27% MAC, Alt @SL FM ADS Δ [%] Vy [km/h] 180 180 0 RC [m/s] 4.39 4.40 0.3 Table 7 – RCMx @ 1179kg, CG @ 27% MAC, Alt @SL FM ADS Δ [%] Vy [km/h] 180 158 -12.2 RC [m/s] 5.89 5.99 1.5 The RC @ 180km/h (Vy) is presented in Table 8 for a flight weight of 1179kg. Table 8 – RC @ 1179kg, CG @ 27% MAC, Alt @SL, Vy = 180km/h FM ADS Δ [%] RC [m/s] 5.89 5.887 -0.05 Validation Report Copyright(c) 2007-2021 Optimal Aircraft Design srl (OAD) - All rights reserved 6/9 Cruise Speed The computed cruise speed (ADS) for different altitudes and power settings is presented in Table 9. Table 9 – Vcr @ 1179kg, CG @ 27% MAC FM ADS Δ Alt [m] PS [%] Vcr [km/h] Vcr [km/h] [%] 610 90 289 292 1.0 1219 84 287 289 0.7 1829 78 285 286 0.4 2438 72 282 283 0.4 3048 67 278 280 0.7 3658 62 272 277 1.8 4267 57 267 272 1.9 Both computed values (ADS) and values taken from the flight manual (FM) are presented in Figure 3. The maximum deviation is less than 2%. Figure 3 – Cruise speed (taken from FM and computed with ADS) 0 500 1000 1500 2000 2500 3000 3500 4000 4500 265 270 275 280 285 290 295 Altitude [m] Vcruise [km/h] FM ADS Validation Report Copyright(c) 2007-2021 Optimal Aircraft Design srl (OAD) - All rights reserved 7/9 Landing The landing distance depends on the runway surface, touchdown speed (VTD) and flare time (Flr. T). The RFC (Rolling Friction Coefficient, brakes on) controls the brake action during the landing. This parameter can have a range of values [0.15 - 0.50] according to the runway surface and the pilot action on the brakes. The flare time is the time required for the aircraft to be rolling on the runway with all wheels on the surface. It starts when the main wheels hit the ground and ends as soon as the nosewheel touches the runway. The landing distance is calculated according to the runway slope and surface, headwind speed, flap deflection, CG position, flight weight and for a RFC equal to 0.39 which represents the friction coefficient on a paved runway and moderate action on the brakes. The conditions used to obtain the landing distance for an asphalt runway are presented in Table 10. Table 10 – Landing distance for a flight weight of 1429kg and RFC=0.39 FM ADS Δ Rwy Alt [m] Flap dflct [º] HW [km/h] VTD [km/h] Flr T [s] RFC Ld run [m] Ld run [m] Ld Run [%] 0 32 0 144 1 0.39 260 270 3.85 0 32 24 144 1 0.39 234 234 0.00 0 16 0 156 1 0.39 331 323 -2.42 0 16 24 156 1 0.39 298 283 -5.03 0 0 0 165 1 0.39 381 368 -3.41 0 0 24 165 1 0.39 343 325 -5.25 914 32 0 151 1 0.39 284 296 4.23 914 32 24 151 1 0.39 256 258 0.78 914 16 0 163 1 0.39 361 351 -2.77 914 16 24 163 1 0.39 325 310 -4.62 914 0 0 172 1 0.39 416 398 -4.33 914 0 24 172 1 0.39 375 353 -5.87 The deviation is influenced by the headwind and flap setting, as shown in Figure 4. The deviation depends slightly on the altitude and increases as the headwind increases for flap settings 50% and 0%. In contrast, for flaps at 100% increasing the headwind speed will result in a lower deviation. Figure 4 – Deviation in function of headwind and flap setting flap 100% flap100% flap 50% flap 50% flap up flap up flap 100% flap 100% flap 50% flap 50% flap up flap up 0 5 10 15 20 25 30 -8.00 -6.00 -4.00 -2.00 0.00 2.00 4.00 6.00 Headwind speed [km/h] Deviation [%] Asphalt runway, h=0m / 914m and M=1429kg h=0m h=914m Validation Report Copyright(c) 2007-2021 Optimal Aircraft Design srl (OAD) - All rights reserved 8/9 Comments The maximum lift is computed from the lift distribution over the lifting surface using the lifting line theory. The lift increment due to flap deflection is computed from the flap type and geometry The total drag is computed making the sum of the drag of each component of the Aircraft, including the interference drag. The empty weight is computed making the sum of the weight of each component of the aircraft. The weight of each component is computed from its geometry. A fudge factor may be used to take into account the material and the skills of the manufacturer. The Center of Gravity position of the aircraft is computed from the mass and position of each component. The center of gravity is computed for different loading configuration. The CG range is computed to ensure stability and maneuverability. The engine performance are computed from an engine database taking into account the flight conditions The takeoff run is the distance between the brake release point and the point where the speed is equal to the liftoff speed and the plane lifts off. The mean acceleration is computed at several speeds, between these two limits, taking into account the engine thrust, the total drag, the wheel friction and the slope of the runway. The length of each segment is computed from the mean acceleration and the speed. The total distance is the sum of the distances travelled in each segment. The rate of climb is computed at a given speed taking into account the engine thrust and the total drag of the airplane. The engine thrust is computed from the engine nominal power and takes into account the effects of altitude, the propeller efficiency and the installation efficiency. The total drag is the sum of the zero lift drag, induced drag and trim drag. The zero lift drag is computed by summing the drag of each component of the aircraft, including the interference drag. The cruising speed is computed for a given flight condition taking into account the power setting, the flight weight, the center of gravity position and the flight altitude. The stall speed is computed flaps up and flaps down taking into account the lift distribution on the wing. The stall is reached when one local lift coefficient reaches its maximum value. The lift distribution is computed from the lifting line theory and takes into account the airfoil profiles and the planform of the lifting surface. The aerodynamic data of each airfoil profile have been computed with XFoil. Not included in this report but processed by ADS: - Static stability - Dynamic stability (free response (eigenmode), step response, harmonic response) - Cost analysis (R&D, Operating, Breakeven, Market price) - Optimization (performance, cost, shape) - Sizing and location of each component/system - Checking for interference between components Sources The ADSV4 computation engine is a compilation of the best algorithms, chosen for their excellent accuracy / time-to-compute ratio. The algorithms are extracted from academic & scientific publications and reference books such as USAF DATCOM, Roskam, Raymer, Torenbeek… Technical notes written by OAD complete them and are directly accessible via the software's interface Validation Report Copyright(c) 2007-2021 Optimal Aircraft Design srl (OAD) - All rights reserved 9/9 List of Symbols ADS Result computed by ADS Cdint Airplane equivalent interference drag coefficient Cfe Airplane friction coefficient CG Center of Gravity % MAC ClMx Maximum lift coefficient FFClMx Fudge factor maximum lift coefficient FFΔClMx Fudge factor maximum lift increment Flap dflct Flap deflection ° Flr. T Landing flare time s FM Value taken from the Flight Manual HW Headwind speed km/h LdRun Landing run m PS Engine Power Setting % RCMx Maximum Rate of Climb m/s RCF Rolling friction coefficient Rot. T Rotation time during takeoff s Rwy Alt Runway altitude m TORun Takeoff run m Vcr Cruise Speed km/h VLO Liftoff Speed km/h VS Stall Speed km/h VTD Touchdown Speed km/h VY Speed for best rate of climb km/h Δ (ADS-FM)/FM % ClMx Maximum lift increment
What's in the Cirrus SR20 TCDS
A Type Certificate Data Sheet (TCDS) is the FAA's record of what an aircraft type was approved as. It is the source of truth for weights, seating, fuel and the rules the design was certified against. Expand any line to see what it means.
844 Cirrus SR20 parts for sale
See all →




Parts listed for sale by vetted eBay sellers — confirmed on eBay at checkout.