Influence of Ethnicity on Passenger Standard Weight
Beechcraft 1900D · Weight And Balance
Overview
This document provides an overview of the importance of accurate weight and balance calculations for aircraft, specifically focusing on the Beechcraft 1900D. It discusses the critical nature of ensuring that aircraft weight remains within certified limits before takeoff, emphasizing the use of standard passenger weights derived from surveys. The paper highlights incidents related to incorrect weight and balance settings, including a notable crash of a Beechcraft 1900D due to overload and imbalance. The document also reviews various aviation safety authority guidelines on passenger weight standards and the need for regular updates to reflect changes in the general population's weight trends. It concludes with findings from a survey examining the influence of ethnicity on average passenger weight, underscoring the necessity for operators to conduct their own surveys to ensure compliance with safety regulations.
- The Beechcraft 1900D must adhere to strict weight and balance regulations to ensure safety during flight operations.
- Standard passenger weights should be regularly updated to reflect changes in the general population's weight.
- Operators are encouraged to conduct their own passenger surveys to determine accurate weights based on their specific demographics.
- The crash of a Beechcraft 1900D was attributed to being overloaded and out of balance, highlighting the importance of accurate weight calculations.
- Different aviation authorities have varying guidelines on standard passenger weights, which must be followed to maintain safety.
Document
Source
Originally published by www.icas.org. Sprinkle hosts a reference copy with an added summary, specifications and searchable full text.
Document details
- Type
- Weight And Balance
- Pages
- 10
- File size
- 856 KB
- Publisher
- www.icas.org
Common. Rarer than 1% of the aircraft models we track.
Most owners only have the POH. Here's the essential set for the Beechcraft 1900D.
- Pilot's Operating Handbook / AFM
- Checklist
- Maintenance Manual
- Parts Catalog (IPC)
- Systems & Wiring
- Service Bulletins
- Type Certificate (TCDS)
Beechcraft 1900D for sale now
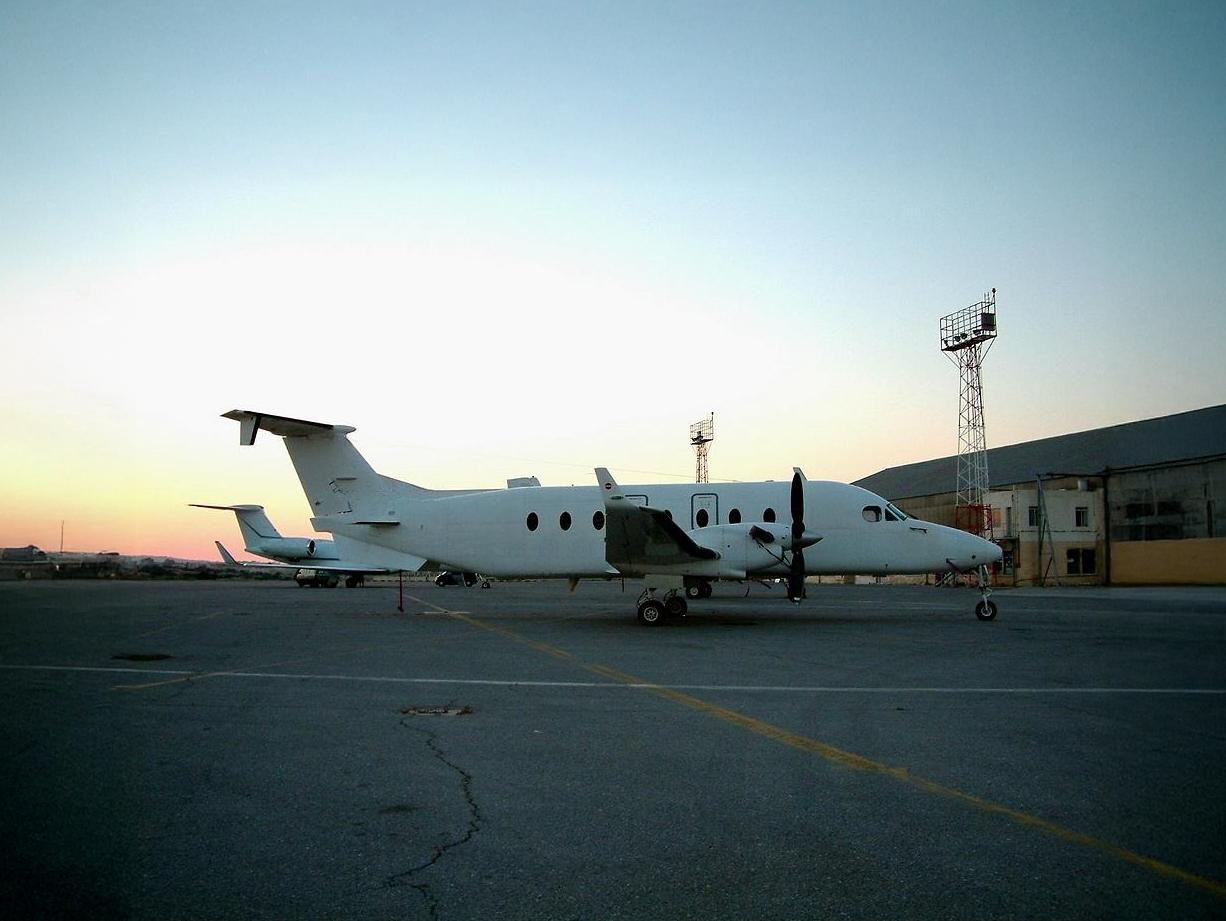


Free — save the 1900D to your watchlist and track it in one place.
More Beechcraft 1900Dmanuals & documents
See all 33 →- SAFETY INVESTIGATION REPORTOther Documents
- Fuel Consumption of the 50 Most Used Passenger AircraftOther Documents
- Type Acceptance Report TAR 98/07 – Beech 1900 SeriesOther Documents
- Airline Transport Pilot Oral Exam Guide—BE-1900 SystemsPilot's Operating Handbook
- BART: MAY - JUNE - 2020Other Documents
- THE FULLY INTEGRATED, ALL-GLASS UPGRADE FOR THE BEECH 1900D GARMIN® G950 NXi RETROFITAvionics Manual
- SERVICE BULLETIN INDEX - April 27, 2017Service Bulletins
- Master Minimum Equipment List (MMEL)Emergency Procedures
- FINAL REPORT ACCIDENT OF M/S. AIRCRAFT SALES AND SERVICES BEECHCRAFT-1900D AIRCRAFT, REG. NO. AP-BII ON 18TH MARCH, 2016 AT JIAP, KARACHIOther Documents
- Advisory Circular Subject: Airworthiness DirectivesSupplemental Type Certificate
- Aircrew Quick Reference Guide to the METAR and TAF CodesV Speeds Reference
- C&L AerospaceService Bulletins
If you fly the Beechcraft 1900D, you may also be researching these.


In this document
Introduction
The introduction emphasizes the importance of calculating the take-off weight accurately, which includes the Operational Empty Weight (OEW), fuel, and payload. It explains how the OEW is determined and the implications of passenger load on overall aircraft weight capacity.
Weight and Balance Regulations
This section outlines the regulations set by various aviation authorities, including EASA and FAA, regarding the use of standard passenger weights for calculating aircraft take-off weight. It discusses the differences in regulations for small versus large aircraft and the necessity of using actual weights for smaller aircraft.
Accident Case Study
The document details a specific incident involving a Beechcraft 1900D that crashed due to being overloaded by 264 kg and out of balance. This case illustrates the critical consequences of improper weight and balance management.
Passenger Surveys
The section discusses the importance of conducting passenger surveys to establish accurate standard passenger weights. It highlights the need for regular updates to these weights based on demographic changes and provides guidelines for conducting such surveys.
Conclusion
The conclusion summarizes the key findings regarding the influence of ethnicity on average passenger weight and stresses the importance of operators conducting their own surveys to ensure compliance with safety regulations.
Safety notes
- Incorrect weight and balance settings can lead to serious accidents, as demonstrated by the Beechcraft 1900D crash.
- Operators must ensure compliance with weight regulations to avoid overloading the aircraft.
Full document text
1 Abstract Aircraft operators must ensure before take-off that aircraft weight and balance are within certified limits. It is common practice in the industry, particularly for large aircraft, that standard weights are used to determine passenger load on the basis that the use of an average weight is an appropriate measure for the actual passenger load. The standard passenger weight is typically derived from surveys and must be reviewed from time to time to reflect the weight variation in the general population. Most aviation safety authorities recommend the use of a standard passenger weight, with variations depending on aircraft size, gender, adult/child, season, etc. For small aircraft weight and balance is particularly critical and actual passenger weight or a higher standard passenger weight must be used. Carry- on baggage can be included in the standard passenger weight or is treated separately. This paper gives an introduction to the issue of aircraft load and balance and gives an overview of the procedures recommended by aviation safety authorities. The paper concludes with a presentation and discussion of an Australian passenger survey to determine the influence of ethnicity on average passenger weight. 1 Introduction Accurate calculation of the take-off weight of an aircraft prior to flight is fundamental to any flight planning process. Aircraft manufacturers place weight limitations on the maximum take-off weight and this is based on the aircraft design and operational limitations. The take-off weight for a given flight and aircraft type is the sum of the Operational Empty Weight (OEW) plus fuel and payload (Fig. 1). The OEW is the sum of the Empty Weight (EW) plus operational items, such as crew, passenger seats, catering, etc. The EW typically does not change much between flights, but may change over time due to maintenance, repair and modifications. The operator can restrict or curtail the manufacturer's loading limitations to account for loading variations and in flight movement that are encountered in normal operations. The passenger load weight makes up one component of the total take-off weight. As more passengers are carried, the amount of weight capacity available for fuel, baggage and other payload is reduced. INFLUENCE OF ETHNICITY ON PASSENGER STANDARD WEIGHT Cees Bil*, Greg Hanlon** *School of Engineering, RMIT University, Melbourne, AUSTRALIA **Five Rings Aerospace Pty Ltd, Keilor East, AUSTRALIA Keywords: weight and balance, aircraft loading, standard passenger weight, survey Fuel Load Payload Operational Empty Weight (OEW) Take-Off Weight Fig. 1: Aircraft take-off weight breakdown. Checked Baggage Trip Fuel Reserve Fuel Cargo Passengers + Carry-On Operational Items Empty Weight (EW) Cees Bil, Greg Hanlon 2 Further to this, as the mean passenger weight increases, the number of passengers that an aircraft can safely carry may reduce. There have been several incidents and accidents attributed to incorrect aircraft weight and balance settings. On 8 January 2003, a Beechcraft 1900D crashed shortly after takeoff. A contribution to the accident was the fact that aircraft was overloaded by 264 kg and out of balance with the CG 5% behind the rear limit. This was attributed to the average passenger weight being 9 kg above the applied standard passenger weight1. On 9 May 2014 a Boeing 737 was under loaded by 4,000 kg due to the fact that a group of children were mistakenly counted as adults. As a result, the stabilizer trim and flaps were set at an incorrect position requiring the flight crew to provide significant back pressure on the elevator during take-off to avoid over rotation2. On 17 January 2004, a Cessna Caravan 208B with nine passengers and one crew member on board crashed shortly after take-off. The subsequent investigation determined that the actual aircraft weight was approximately 15% over gross weight3. Industry practice is to use standardised passenger weights to calculate aircraft take-off weight. Standardised weights are based on an assumption that the individual weights of all passengers will average out to a mean passenger weight and the use of a mean passenger weight will not cause the aircraft weight limitation to be exceeded. However, when using a mean passenger weight errors can occur between the actual passenger load weight and the calculated passenger load weight. For statistical reasons these errors become more significant in terms of their effect on aircraft performance as the size of the aircraft, and therefore seating capacity, reduces. Standard passenger weight needs to be re- evaluated over time to reflect weight variation trends in the travelling public. For example, the Federal Aviation Administration (FAA) recommends that standard passenger weight is revised when the average weight of the general public changes by 2%4. Figure 2 shows the increase of average weight of males and females in Australia from 1995 to 2011/2012 for various age groups5. The trend shows an average weight increase of about 0.4% (0.3 kg) per year. Fig. 2: Australian Population Weight Trend 1995 – 2011/2012 for different age groups and gender5. This trend suggests that a passenger survey should be conducted about every 5 years, following the IATA guidelines (2% variation). 2 Overview Aircraft Load and Balance Regulations Although operators are responsible to ensure the aircraft weight and balance remains within the operational limits specified by the manufacturer, international aviation safety regulators provide guidance on procedures for estimating passenger and carry-on baggage load. European Aviation Safety Agency (EASA) The European Aviation Safety Agency (EASA) was established in 2002 as a Europe-wide aviation regulatory authority which has absorbed most functions of the JAA (in the EASA Members states). The standard passenger weight procedure is shown in Table 1 for medium to large aircraft (seats ≥ 20) and Table 2 for small aircraft (seat < 20). These values
Show full textShow less
include personal items and carry-on baggage. 3 INFLUENCE OF ETHNICITY ON PASSENGER STANDARD WEIGHT Table 1: EASA Standard Passenger Weight for medium and large aircraft (EU-OPS 1.620)6 Passenger seats 20 and more 30 and more Male (kg) Female (kg) All adult (kg) All flights except holiday charters 88 70 84 Holiday charters 83 69 76 Children 35 35 35 Table 2: EASA Standard Passenger Weight for small aircraft (EU-OPS 1.620)6 Passenger seats 1 - 5 6 - 9 10 - 19 Male (kg) 104 96 92 Female (kg) 86 78 74 Children (kg) 35 35 35 In 2009, EASA commissioned an extensive survey involving 22,901 passengers7. The survey collected a substantial amount of information, including season, type of operation, departure airport, cabin baggage weight and checked baggage weight. Table 3 shows the recommended standard passenger weight, including personal items and carry-on baggage. Table 3: EASA 2009 Survey Recommended Standard Passenger Weight7. Passenger seats 20 and more 30 and more Passengers Male (kg) Female (kg) M/F ratio All Adult (kg) All Flights 94 75 7/3 88 Although the survey concluded that the weight of male and female passengers had increased, it was less than expected. This was attributed to the fact that the original standard passenger weight was based on 80/20 male/female ratio, while the survey showed that this ratio should be 70/30, ie. more females are travelling. The survey showed that a significant weight difference exists for male and female passengers, but the differentiation between seasons or type of operation (charter/scheduled) is not significant and can be absorbed in a single standard passenger weight. The survey did not include flights with aircraft with a seat capacity of less than 20. The South African CAA regulations on standard passenger weight are similar to that of the EASA8. Federal Aviation Administration (FAA) The FAA regulations divide aircraft categories in large cabin (seats > 71), medium cabin (30 < seats < 70) and small cabin (5 ≤ seats < 29). Operators of aircraft with less than 5 seats must use actual weights. Operators of large cabin aircraft may use standard passenger weight or use their own approved passenger weight as determined through a survey. Medium cabin size aircraft are considered as small cabin size aircraft, unless certain loadability and loading schedule are met, in which case it can be considered as a large cabin aircraft. Operators of small cabin aircraft may use one of the following procedures4: 1. Use actual passenger and bag weights, or 2. Use segmented passenger weights and bag weights prescribed for large cabin aircraft, or 3. Use the standard average passenger and bag weights prescribed for large cabin aircraft or approved average weights if: a) The aircraft was certificated under part 23 commuter category, part 25, or part 29 and b) The operator applies additional curtailments in the CG envelope. FAA standard passenger weights are shown in Table 4. Table 4: FAA Standard Passenger Weight4. Standard Average Passengers Weight (lb) Season Summer Winter Average adult passenger 190 195 Male passenger 200 205 Female passenger 179 184 Child (2 yrs to less than 13 yrs of age) 82 87 The standard passenger weights include 5 lb for summer clothing and 10 lb for winter clothing. It includes 16 lb for personal items and Cees Bil, Greg Hanlon 4 carry-on baggage. Operators may reduce standard passenger weight by 6 lb if they have a no carry-on baggage policy. The concept of segmented weights involves adding a portion of the standard deviation to an average weight to increase the confidence that the actual weight will not exceed the average weight. The segmented weights in Table 5 were derived from average weights and standard deviations found based on statistical weight data, assuming a 95% confidence interval and 1% tolerable error. Table 5: Segmented weights (lb) for adult passengers (in summer)4. Max certified passenger seating capacity Ratio Male/Female 0/100 20/80 40/60 80/20 100/0 1 - 4 Use actual weights or volunteered weights plus 10 lb 5 231 235 239 247 251 6 - 8 219 223 227 235 239 9 - 11 209 213 217 225 229 12 - 16 203 207 211 219 223 17 - 25 198 202 206 214 218 26 - 30 194 198 204 210 214 31 - 53 191 195 199 207 211 54 – 70+ 188 192 196 204 208 An operator may reduce passenger weight by 6 lb if it has a no carry-on bag policy. An operator should add 5 lb to passenger weight during the winter season. Civil Aviation Authority of New Zealand The Civil Aviation Rules of the Civil Aviation Authority of New Zealand place aircraft involved in air transport operations into three groups: Part 12111: o Seating configuration of more than 30 seats, excluding any required crew member seat; or o Payload capacity of more than 3,410 kg. Part 12512: o Passenger seating configuration of 10 to 30 seats; or o Payload capacity of 3,410 kg or less and a MTOW of greater than 5,700 kg; or o Single engine and is carrying passengers under IFR. Part 13513: o Seating configuration of 9 seats or less, excluding any required crew member seat, and a MTOW of 5,700 kg or less, except for a single engine aircraft used for an air operation carrying a passenger under IFR; or o Helicopter. In 2003, the New Zealand CAA commissioned a survey involving 15,000 passengers10. Table 6 shows the average passenger weight for different categories of medium and large aircraft (Part 125 and 121 respectively). Table 7 shows the survey result for average weight of male and female passengers. In 2004, the New Zealand CAA updated their standard passenger weight recommendations. Table 6: CAA New Zealand Standard Passenger Weight10. Mean Weight (kg) Std. Dev. Std. Error 95% Confidence Interval (kg) Passenger Part 121 Part 125 80.5 81.0 17.6 17.0 0.19 0.20 80.13-80.87 80.60-81.40 Carry-on Part 121 Part 125 5.3 4.8 3.7 3.7 0.04 0.04 5.22-5.38 4.71-4.89 Combined Part 121 Part 125 85.8 85.8 18.2 17.6 0.20 0.21 85.38-86.14 85.34-86.18 Table 7: 2003 Survey results for average weight for male and female passengers10. Mean Weight (kg) 95% Confidence Interval (kg) Passenger weight Male Female 88.5 71.9 88.17 – 88.83 71.54 – 72.26 Carry-on Baggage Male Female 5.4 4.9 5.31 – 5.49 4.82 – 4.98 The combined average weight (passenger + carry-on baggage) was 93.9 kg for male passengers and 76.8 kg for female passengers. 5 INFLUENCE OF ETHNICITY ON PASSENGER STANDARD WEIGHT This compares with 92.5 kg and 73.7 kg respectively for a similar survey conducted in 1999, an increase of about 1.5%. The rules permit the weight of passengers to be established by one of the following methods9: 1. Actual weight of every passenger and their carry-on baggage; 2. Approved standard weight for every passenger and their carry-on baggage as established by the operator; 3. Standard weight for every passenger and their carry-on baggage: a) 15 kg for a child under 2 years of age; b) 46 kg for a child of the age of 2 years and under the age of 13 years; c) 86 kg for a person of or over the age of 13 years. For Part 135, the total weight of passengers, excluding their carry-on baggage (if any), must be determined by using only one of the following: 1. Actual weight of every passenger; 2. Approved standard weight for every passenger that is established by the operator; 3. Weight that is declared by the passenger plus an additional 4 kg for every passenger. The CAANZ AC 119-4 provides methods for generating exposition passenger weights for operators who chooses not to use the standard passenger weights, actual weights or passenger declared weights, made available under CAR Parts 121, 125 and 135, but determine their own exposition passenger weight through other means, e.g. a survey9. Civil Aviation Safety Authority (Australia) The practice in Australia has been to use the one standard passenger weight, irrespective of the size of the aircraft. However, this practice increases the probability of overloading the aircraft as passenger capacity decreases, and vice versa. For example, when a standard weight of 77 kg is used in a 12 passenger aircraft instead of actual weights, the statistical probability of overloading the aircraft is as high as 25%. This probability diminishes to 0.0014% if the same standard weight of 77 kg is used on a very large capacity aircraft, such as a 400 passenger Boeing 747. To keep the probability of overloading within acceptable limits, a sliding scale of standard weights based on the seating capacity of the aircraft was introduced. It is also more accurate to allocate different standard weights to men and women, since a single standard weight would have to account for the effect of the larger standard deviation of a population of adults which does not discriminate between gender. For greater accuracy, separate standard weights for male and female adults (17 years and older) are applied. While adult weights have usually been used in the past for teenagers, the use of adult weights imposes a load penalty. Consequently, a new classification of adolescent (13 to 16 years old) is introduced. The Civil Aviation Safety Authority (CASA) in Australia recommends the standard passenger weights for all aircraft according to seating capacity as shown in Table 8 (CAAP 235-1)14: Table 8: CASA standard passenger weight14. Seating capacity (incl. crew) Male Fem- ale Infant Child Adolescent 13 – 16 yrs (kg) Male Fem- ale 7 - 9 86 71 17 44 65 58 10 -14 86 70 16 43 64 58 15 - 19 85 69 16 43 63 57 20 - 39 84 69 16 42 63 57 40 -59 83 68 16 42 62 56 60 - 79 82.5 67.3 16 41 61.4 55.4 80 - 99 82.5 67.1 16 41 61.2 55.3 100 - 149 82 66.9 16 41 61.1 55.2 150 - 299 81.8 66.7 16 41 60.9 55.0 300 - 499 81.4 66.3 16 41 60.6 54.8 500+ 81.2 66.1 16 41 60.5 54.7 This table does not include personal items and carry-on baggage, which has to be determined separately. The use of standard passenger weight is not advised for aircraft with a seating capacity of less than 7. Cees Bil, Greg Hanlon 6 Figure 3: Standard passenger weights for different categories as recommended by aviation safety authorities. Figure 3 gives a summary of standard passenger weights recommended by different aviation safety authorities. Note that the CASA standard passenger weight does not include personal items and carry-on baggage. This must be determined separately. Other regulations give an “all in” weight. As shown in this overview, the civil aviation regulations concerning passenger load determination does not vary much between regulations. For medium to large aircraft a standard passenger weight, possibly differentiated between male/female/child categories, may be used, either recommended by the regulator or determined by the operator through an approved survey. Some guidelines recommend a sliding scale for standard passenger weight depending on aircraft size (by number of seats), e.g. CASA and New Zealand CAA. Actual passenger weight, either weighed or declared, must be used for small aircraft. Passenger surveys must be conducted to update standard passenger weight due to general weight variation in the population. A survey conducted in 2005 among airlines, showed that the majority of airlines (32%) use their own standard passenger weight. About 27% use the EU-OPS 1.620 standard passenger weights, while 18% use the standard passenger weight as recommended by their local National Aviation Authority (other than FAR or JAR). About 18% use FAA AC 120-27E with allowances including seasonal variations and 5% use JAR-OPS 1 standards with separate accounting of male/female/child. In addition, add 6 kg per business-class passenger and 12 kg per first-class passenger to account for additional carry-on. The FAA segmented weight methodology was not used by any of the airlines surveyed. This survey shows that airlines prefer to use their own standard passenger weight so they can use information that is more pertinent to their specific requirements and operations. Some civil aviation authorities make provisions for this in their advisory, with the proviso that the methodology and results have to be approved. An approved operator specific passenger weight usually has a validity period after which a new survey must be conducted. 3 Passenger Surveys The use of passenger surveys is an appropriate method to determine a standard passenger weight. As part of an ongoing process to have an up-to-date standard passenger weight, regular reviews of the mean adult passenger weight are required. The regulator typically carries out surveys of passenger weights when there is sufficient evidence to indicate that the actual mean passenger weight has shifted by 2% or more. This figure is in line with the International Air Transport Association’s (IATA) guidelines for conducting passenger weight surveys. Operators may conduct their own surveys to establish a more representative standard weight for passengers. The resultant survey 0 10 20 30 40 50 60 70 80 90 100 Male Female Infant (< 2 yrs) Child (2 - 13 yrs) Adolescents (13 - 16 yrs) Male Adolescents (13 - 16 yrs) Female Standard Passenger Weight (kg) 7 INFLUENCE OF ETHNICITY ON PASSENGER STANDARD WEIGHT weight may be influenced by factors such as gender ratios, specific tourist groups, or the amount of carry-on baggage taken on board an aircraft. The effect of these factors may result in a standard passenger weight from a survey being different to the one recommended by the National Aviation Authority. An operator may conduct a survey for a particular route if the operator believes that the average weights on that route may differ from those in the rest of its operations. To establish a standard average passenger weight along the route, an operator may survey passengers at only one location. However, an operator should conduct surveys of personal items and bags at the departure and arrival locations, unless the operator can verify there is no significant difference in the weight and number of bags in either direction along the route. The survey method and findings must be approved by the National Aviation Authority before they become valid. Standard passenger weights need to remain current. Operators should verify that the standard weight specified in their exposition is up-to-date to reflect changes in the type of passengers being carried or whenever the CAA establishes a shift (of over 2%) in the general mean weight of passengers. The FAA recommends a new survey every 3 years. In designing a survey, an operator should consider: 1. The sample size required to achieve the desired reliability, 2. The sample selection process, and 3. The type of survey (average weights or a count of items). Table 9 shows the FAA recommended minimum sample size and tolerable error for a range of weight items. Table 9: FAA recommended minimum survey sample. Survey subject Minimum sample size Tolerable error Adult 2,700 1% Child 2,700 2% Checked bag 1,400 2% Heavy bag 1,400 2% Plane-side loaded bags 1,400 2% Personal items and carry- on bags 1,400 2% Personal items only (for operators with a no carry- on bag program) 1,400 2% If the operator choses to use a sample size that is smaller than that provided in Table 9, the operator should collect a sufficient number of samples to satisfy the following formulas: 𝑠 = √∑ (𝑥𝑗 − 𝑥̅)2 𝑛 𝑗=1 𝑛 − 1 where s is the standard deviation, n is the sample size, xj is the individual survey weights and 𝑥̅ is the sample average, and: 𝑒 = 1.96 𝑠 100 √𝑛 𝑥̅ where e is the tolerable error percentage. EASA recommends for a minimum sample size, the greater of: Relative confidence range (accuracy) of 1 % for all adult and 2% for separate male and female average masses and for aircraft: a) with a passenger seating capacity of 40 or more, a total of 2,000 passengers; or Cees Bil, Greg Hanlon 8 b) with a passenger seating capacity of less than 40, a total number of 50 x the passenger seating capacity. 4 Australian Passenger Survey Although the aim of standard passenger load procedures is foremost to avoid overloading the aircraft and impinging on safety, underestimating passenger load may have an economic impact. Aircraft operators are allowed to adjust their passenger load procedure, subject to approval, if it can be justified based on more pertinent data for example type of operation, e.g. charter, fly-in/fly-out, leisure/business travel, region of operation, local population, etc. In the Australian context, international operators typically carry passengers of different ethnicity with many flights serving the Asia- Pacific region. It is interesting to determine if ethnicity has an impact on the standard passenger weight. A passenger survey commissioned by the CAA in New Zealand CAA also differentiated between based ethnicity. New Zealand is geographically in a similar situation as Australia, with many flights serving the Asia- Pacific region. The results are shown in Table 10 for different ethnic categories. Table 10: Influence of Ethnicity on Average Passenger Weight (2003 survey New Zealand CAA). Ethnicity Mean weight (kg) Std. Dev Std. Err. 95% Conf. Interval Male European 89.2 14.8 0.17 88.87-89.53 Maori/Pacific 98.0 21.1 1.24 95.58-100.42 Asian/Indian 76.5 14.1 0.54 75.44-77.56 Female European 72.6 15.0 0.19 72.22-72.98 Maori/Pacific 81.4 19.2 1.13 79.18-83.62 Asian/Indian 60.5 11.5 0.46 59.6-61.39 An Australian survey was conducted among 4,617 passengers on an Asia-bound flight in accordance with the procedure outlined in FAA AC 120-27E4. Table 11 shows the findings for the different categories. The survey results show that the difference in average weight between different ethnic groups can be 20 kg. Table 11: Distribution of Passengers Surveyed. Business (kg) Economy (kg) Ethnicity Male Female Male Female Subt otal Asian 81.2 61.6 75.6 60.9 67.6 Caucasian 96.5 73.7 90.2 75.5 84.5 Pacific 104.0 0.0 99.7 89.4 95.4 Other 89.6 102.9 181.8 68.9 78.4 Average 87.5 64.8 80.7 64.2 Business Economy Ethnicity Male Female Male Female Average Total St. Dev Asian 14.8 10.2 12.8 9.6 13.6 16.8 Caucasian 18.2 11.9 16.8 14.8 17.8 Bus. St. Dev Pacific 9.9 0.0 8.2 12.7 22.5 19.2 Other 0.0 0.0 8.2 12.7 12.5 Econ St. Dev Average 17.7 12.2 15.9 12.7 16.5 As per requirements of FAA, the survey was based on random selection of passengers. The following equation was used to calculate the average weight of the groups: 𝑥̅ = ∑ 𝑥𝑗 𝑛 𝑗=1 𝑛 The following equation was used to calculate the standard deviation of the data: 𝑠 = √∑ (𝑥𝑗 − 𝑥̅)2 𝑛 𝑗=1 𝑛 − 1 Sample data calculation is shown in Table 12. Table 12: Survey sample data processing. Gende r Ethnici ty Clas s Weigh t (𝒙𝒋 − 𝒙̅ ) (𝒙𝒋 − 𝒙̅ )𝟐 1 F C E 61.0 -22.3 497.8 2 F C E 61.0 -22.3 497.8 3 F C E 62.0 -21.3 454.2 4 F C E 78.0 -5.3 28.2 5 F C E 87.0 3.7 13.6 6 F C E 74.6 -8.7 76.9 7 F C E 156.0 72.7 5283.5 8 F C E 86.9 3.6 12.9 sub total 666.5 6864.0 mean 83.3 9 INFLUENCE OF ETHNICITY ON PASSENGER STANDARD WEIGHT The sample average is 𝑥̅ = 666.5 8 = 83.3 kg and the standard deviation is 𝑠 = √6864.0 8−1 = 31.31 kg. From the survey data, the resulting confidence interval was calculated which represent the range in which 95% of the statistical data lies between. The following equation is used (Table 13): 𝑥̅ ± 1.96 × 𝑠 √𝑛 𝑥̅ ± 1.96 × 31.31 √8 = 61.6 kg-105.0 kg Table 13: Survey Confidence Intervals Ethnicity Male (kg) Female (kg) Male (kg) Female (kg) Asian 81.2 + 2.7 61.6 + 1.9 75.6 + 0.7 60.9 + 0.5 Caucasia n 96.5 + 4.1 73.7 + 3.9 90.2 + 1.3 75.5 + 1.3 Pacific 104 + 13.7 0 + 0 99.7 + 18.5 89.4 + 18.6 Other 89.6 + 0 102.9 + 0 81.8 + 3.9 68.9 + 7.9 Average 87.5 + 2.5 64.8 + 2 80.7 + 0.7 64.2 + 0.5 Average Class 77.7 + 2 72.1 + 0.5 Total Average 72.5 + 0.5 To increase the reliability of the survey result, the upper bound of the confidence interval was taken as the final result. This is also due to the low number of participants in some categories such as female business class passengers. The average male passenger weight from the survey is 1 kg higher than the recommended CASA average weight and 11.2 kg less than the FAA average weight. The average female weight from the survey is 1.2 kg less than the recommended CASA average weight and 8.8 kg less than the FAA average weight. The overall total average weight is 73 kg from the survey and CASA. However, FAA average weight is 15.6 kg higher than both CASA and the survey average. The average passenger weight is slightly lower than expected and this is mainly due to the high percentage of Asian ethnicity passengers involved in this survey compared to the Caucasian, Pacific and other ethnicity. It can be concluded than the total average weight will be dominated by the average weight of Asian ethnicity passengers. Survey results showed that 76% of the surveyed passengers were of Asian ethnicity compared to 23% Caucasian. The large average weight range between the business class and economy class is because the business class passengers are allowed to carry two carry-on items instead of one which is allowed for economy class passengers. As there is a low number of business class passengers surveyed, the 95% confidence interval calculated was much higher for business class passengers (±2 kg) compared to economy class passengers (±0.5 kg). 5 Conclusion Determining the correct passenger and cabin baggage load is critical in commercial aircraft operations as it effects the aircraft weight and CG location. Except for very small aircraft, passenger and cabin baggage load is usually determined by applying a standard weight for different categories of passengers and cabin baggage as determined through passenger surveys. These surveys need to be repeated to take into account weight variations in the general population. This paper presented an overview of the current regulations as effective in some countries on passenger and cabin baggage loading for commercial aircraft. Its showed that there are minor differences, particularly in the different categories that standard passenger weight is applied. EASA categorises passengers in male, female and child and divides aircraft capacity into less than 20 seats, 21 – 29 seats and 30 or more seats. The FAA also has a male, female and child passenger category, with different standard weights for summer and winter flights to account for different clothing. Aircraft with less than 5 seats must use actual weights. The CAA of New Zealand has infant, child and adult passenger category. Aircraft with seat capacity of 9 or less must use actual weight or a standard Cees Bil, Greg Hanlon 10 weight determined by the operator. The CASA in Australia applies infant, child, adolescent, male and female passenger category, but has a refined breakdown of standard passenger weight per aircraft seating capacity from 7 to 500+. Cabin baggage is either counted separately or included in the standard passenger weight. All regulations allow operators to apply their own standard passenger weight to best suit their specific operations, provided the survey and results have been approved by the National Aviation Authority. To determine the effect of ethnicity on passenger load, a passenger survey was conducted for a flight between Australia and Asia. Passenger ethnicity category Caucasian, Asian, Pacific and Other were considered. Although the average passenger weight was close to the standard passenger weight recommended by CASA, the survey did show a significant weight difference between ethnic categories, with Pacific the highest average weight, followed by Caucasian and Asian the lowest average weight. In conclusion, ethnicity has an effect on average passenger weight and it is essential that operators who typically carry a relatively large number of passenger in a particular ethnic category should consider their own passenger survey as the recommended standard passenger weight may be too low, which could result in overloading, or too high, which means the weight is below MTOW which may cause a loss in revenue. Acknowledgement Part of this work was funded through a research grant from the Civil Aviation Safety Authority. The information presented and opinions expressed herein are those of the author(s) and do not necessarily represent the views of the Australian Civil Aviation Safety Authority. References [1] National Transportation Safety Board: Loss of Pitch Control During Takeoff Air Midwest Flight 5481 Raytheon (Beechcraft) 1900D, N233YV Charlotte, North Carolina, January 8, 2003, Air Accident Report NTSB/AAR-04/01, 26 February 2004, Washington, DC. [2] Australian Transport Safety Bureau: Loading Issue Involving a Boeing 737, VH-VZO, Aviation Occurrence Investigation AO-2014-088, 2 September 2014, Canberra. [3] Transport Safety Board of Canada: Loss of Control, Georgian Express Ltd., Cessna 208B Caravan, C- FAGA, Pelee Island, Ontario, 17 January 2004, Aviation Investigation Report A04H0001, 2006, Ottawa. [4] Federal Aviation Administration: Aircraft Weight and Balance Control, Advisory Circular AC 120-27E, 10 June 2005, Washington, DC. [5] Australian Bureau of Statistics: Australian Health Survey: First Results, Report 4364.0.55.001, Canberra, 2012. [6] European Aviation Safety Agency: Commission Regulations (EC) No 859/2008, EU-OPS 1.620, 20 August 2008, Brussels. [7] Berdowski, Z. et. al.: Survey on standard weights of passengers and baggage, EASA 2008.C.06/30800/R20090095/30800000/FBR/RLO, Zoetermeer, May 2009. [8] South African Civil Aviation Authority: Aircraft Mass and Balance Control Advisory Circular, CA AOC-AC-FO-003, 18 September 2015. [9] Civil Aviation Authority of New Zealand: Passenger, Crew and Baggage Weights, Advisory Circular AC- 119-4, 28 October 2005, Lower Hutt, New Zealand. [10] NFO New Zealand: 2003 Survey of Passenger Weights Market Research Report, November 2003. [11] Civil Aviation Authority of New Zealand: CAA Consolidation Part 121: Air Operations — Large Aeroplanes, 1 February 2016. [12] Civil Aviation Authority of New Zealand: CAA Consolidation Part 125: Air Operations — Air Operations — Medium Aeroplanes, 1 February 2016. [13] Civil Aviation Authority of New Zealand: CAA Consolidation Part 135: Air Operations — Helicopters and Small Aeroplanes, 1 February 2016. [14] Civil Aviation Safety Authority: Standard Passenger and Baggage Weights, Civil Aviation Advisory Publication 235-1(1), September 1990. Contact Author Email Address Mailto: bil@rmit.edu.au Copyright Statement The authors confirm that they, and/or their company or organization, hold copyright on all of the original material included in this paper. The authors also confirm that they have obtained permission, from the copyright holder of any third party material included in this paper, to publish it as part of their paper. The authors confirm that they give permission, or have obtained permission from the copyright holder of this paper, for the publication and distribution of this paper as part of the ICAS 2016 proceedings or as individual off-prints from the proceedings.
What's in the Beechcraft 1900D TCDS
A Type Certificate Data Sheet (TCDS) is the FAA's record of what an aircraft type was approved as. It is the source of truth for weights, seating, fuel and the rules the design was certified against. Expand any line to see what it means.
376 Beechcraft 1900D parts for sale
See all →




Parts listed for sale by vetted eBay sellers — confirmed on eBay at checkout.